Percona之前的监控是以Plugin或Template的方式加载到其他的监控软件上,支持Zabbix、Nagios和Cacti等3个常用的监控软件。
Percona Monitoring and Management (PMM)是一款开源的用于管理和监控MySQL和MongoDB性能的开源平台,通过PMM客户端收集到的DB监控数据用第三方软件Grafana画图展示出来。
PMM功能简述
PMM提供了对MyISAM、InnoDB、TokuDB和PXC/Glarera的监控,另外也提供了Query Analytics的功能,可以检视执行了哪些SQL指令,并对执行效能较差的语法进行优化。
PMM针对操作系统的部份也提供了硬盘、网络、CPU和RAM的监控,特别的是它提供了Context switches、Processes和interrupts的监控,Context Switches可以看到CPU上下切换文的状况,Processes可以方便了解系统有多少程序在等待I/O。
PMM架构
PMM架构如下图所示

PMM Server是作为Docker镜像distributed,而PMM Client就是一般的RPM,它需要安装Server端和Client端软件。
Server组件
Query Analytics(QAN)是用来搜集指令并作性能分析的,其组件分别说明如下:
- QAN API:作为percona-qan-agent后端储存和读取Query资料用。
- QAN APP:提供图形化分析介面
Metrics Monitor(MM)组件提供了MySQL和MongoDB历史监控信息,其组件分别说明如下:
-
Prometheus:一个开源的服务监控系统和时间序列数据库,它连接到PMM Client上的exporter聚集DB的监控数据。
- Consul:提供API让PMM Client可以远端替Prometheus新增、移除hosts,同时它也储存了监控的metadata -
Grafana:这是一个第三方Dashboard和图形构建器,用于可视化Prometheus中聚合的数据,以Web呈现。
- Percona Dashboards:是由Percona开发的一组用于Grafana的仪表板
上述的2个Web页面都能从PMM Landing Page(就是PMM首页)直接连结。
Client组件
- ppm-admin:命令行的PMM Client管理工具,用来新增、移除监控的资料instance。
- percona-qan-agent:用于搜集QAN查询效能性能资料,同时连结和传送资料给PMM Server中的QAN API。
- node_exporter:Prometheus exporter用于搜集一般系统信息。
- mysqld_exporter:Prometheus exporter用于搜集MySQL Server的信息。
- mongodb_exporter:Prometheus exporter用于搜集MongoDB server的信息。
PMM安装
概览:用一台A服务器运行监控程序,监控程序是基于Docker构建的。然后在需要被统计的服务器上安装pm-admin,这个工具会将数据实时的发送到A服务器。A服务器会分析统计数据,然后将数据展示在web端。
PMM Server安装
Percona发布了PMM Docker镜像,用户只需要下载镜像运行就全部搞定,开箱即用相当easy!
- Docker 安装
Docker 的安装资源文件存放在Amazon S3,会间歇性连接失败。所以安装Docker的时候,会比较慢。
你可以通过执行下面的命令,高速安装Docker。
1 | $ curl -sSL https://get.daocloud.io/docker | sh |
适用于Ubuntu,Debian,Centos等大部分Linux,会3小时同步一次Docker官方资源。
- 创建数据容器
1 | $ docker create \ |
- 运行PMM Server
1 | $ docker run -d \ |
- 查看Docker运行状态
1 | $ docker ps |
- 访问PMM
打开浏览器 http://10.211.55.8/ 即可
| Component | URL | 备注 |
|---|---|---|
| PMM landing page | http://10.211.55.8 | PMM跳转页 |
| Query Analytics (QAN web app) | http://10.211.55.8/qan/ | SQL慢日志分析 |
| Metrics Monitor (Grafana) | http://10.211.55.8/graph/ | user name: admin password: admin 监控指标图表 |
| Orchestrator | http://10.211.55.8/orchestrator | MySQL集群拓扑结构 |
PMM Client安装
PMM Client 负责收集MySQL的状态数据,并发给PMM Server。
- 安装PMM Client
以Ubuntu为例,下载相应客户端安装包并安装。
1 | $ wget https://www.percona.com/downloads/pmm-client/pmm-client-1.1.1/binary/debian/xenial/x86_64/pmm-client_1.1.1-1.xenial_amd64.deb |
其它系统的客户端可在https://www.percona.com/downloads/pmm-client/下载。
- 配置监控
连接PMM server
1 | $ pmm-admin config --server 10.211.55.8 |
增加监控服务
MySQL
1 | $ pmm-admin add mysql --user root --password 000000 --host 127.0.0.1 --port 3306 |
pmm-client可以按host和port进行配置,pmm-client是否无须部署到MySQL对应的机器上呢?
pmm-client收的监控数据来源有这么几方面:
a.MySQL所在机器的系统指标
b.MySQL的performance_schema库
c.slow-log(慢查询日志)
如果我们想收集a和c中的指标的话,最好还是将pmm-client部署在MySQL所在机器。
更多的设定內容可以用下列指令查询:
1 | $ pmm-admin add mysql --help |
MongoDB
1 | $ pmm-admin add mongodb --cluster rs1 --uri mongodb://admin:123456@localhost:27017 |
更多的设定內容可以用下列指令查询:
1 | $ pmm-admin add mongodb --help |
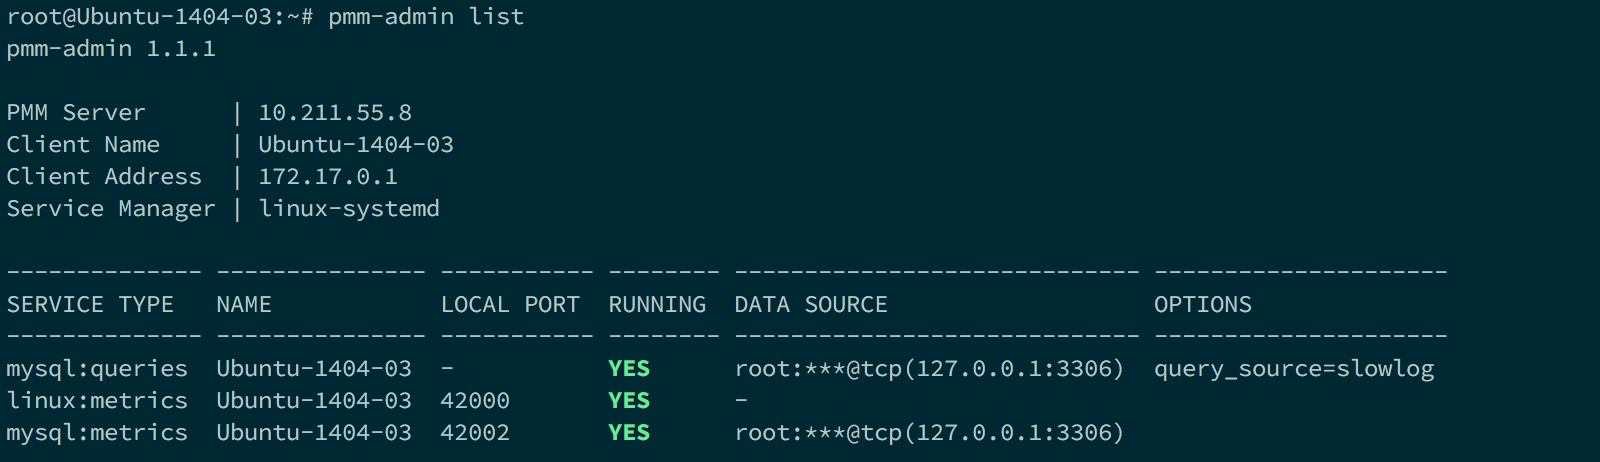
查看配置后的结果
监控页面展示
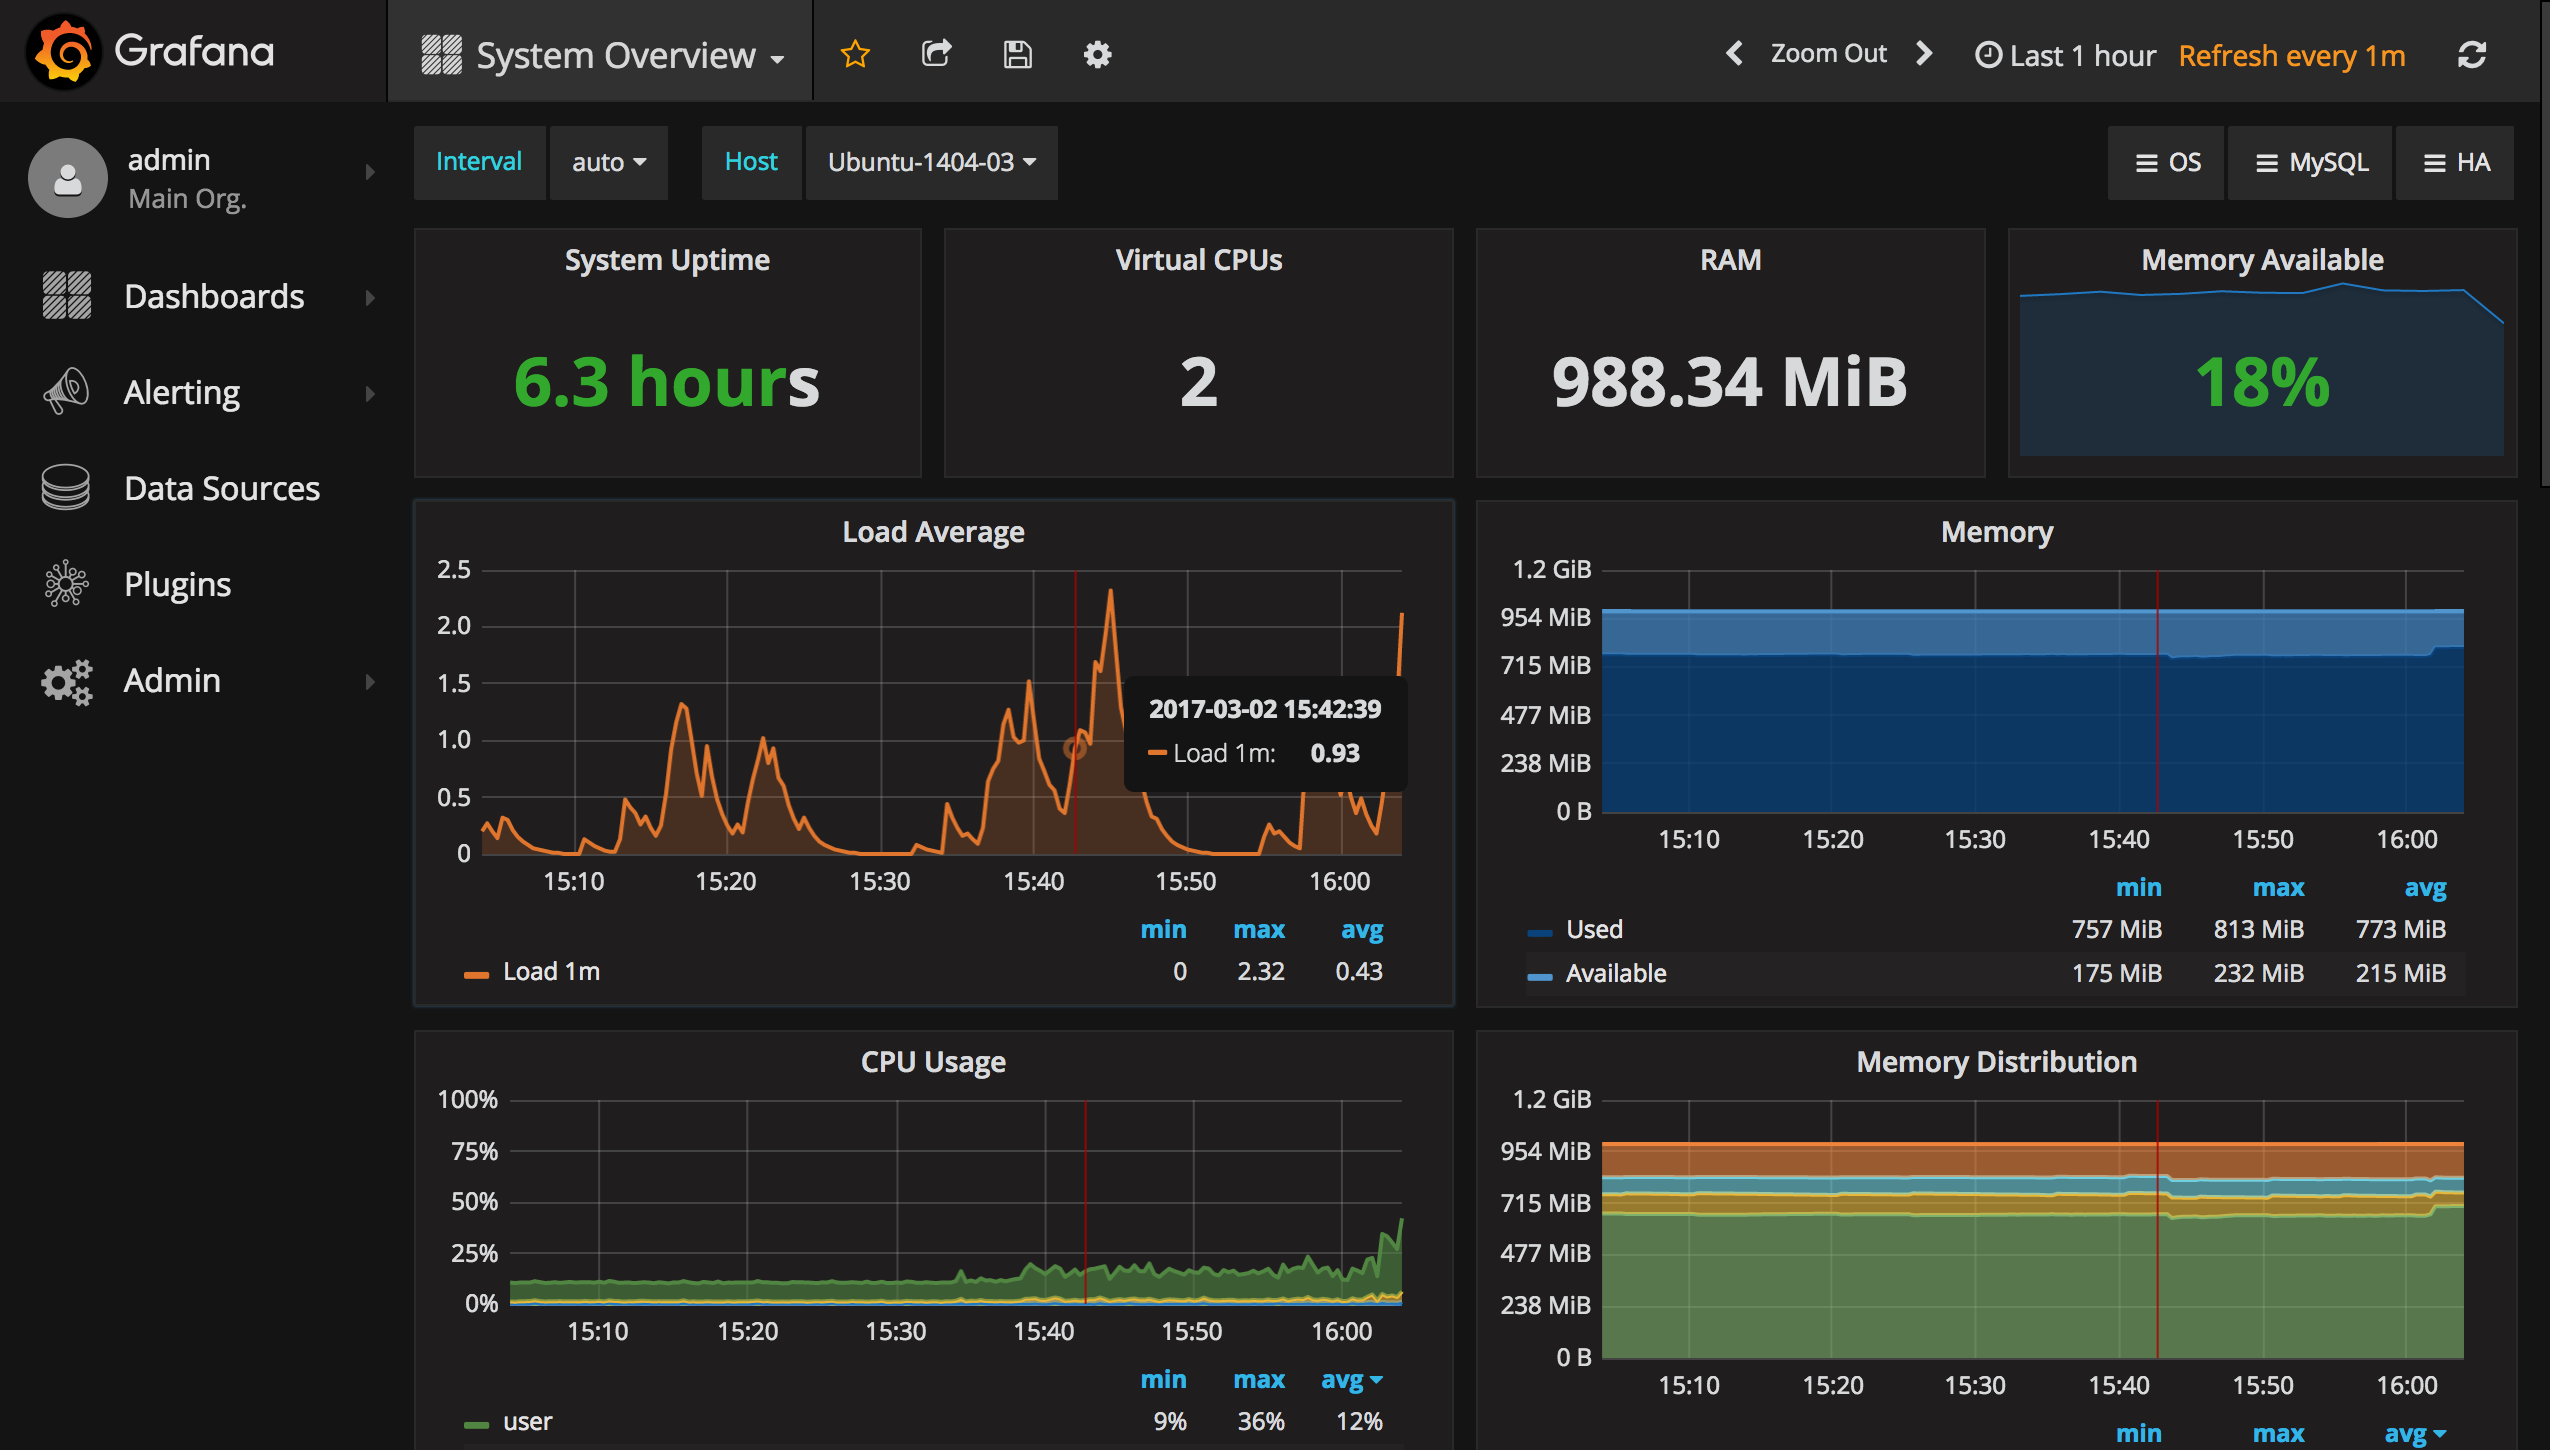
- OS系统
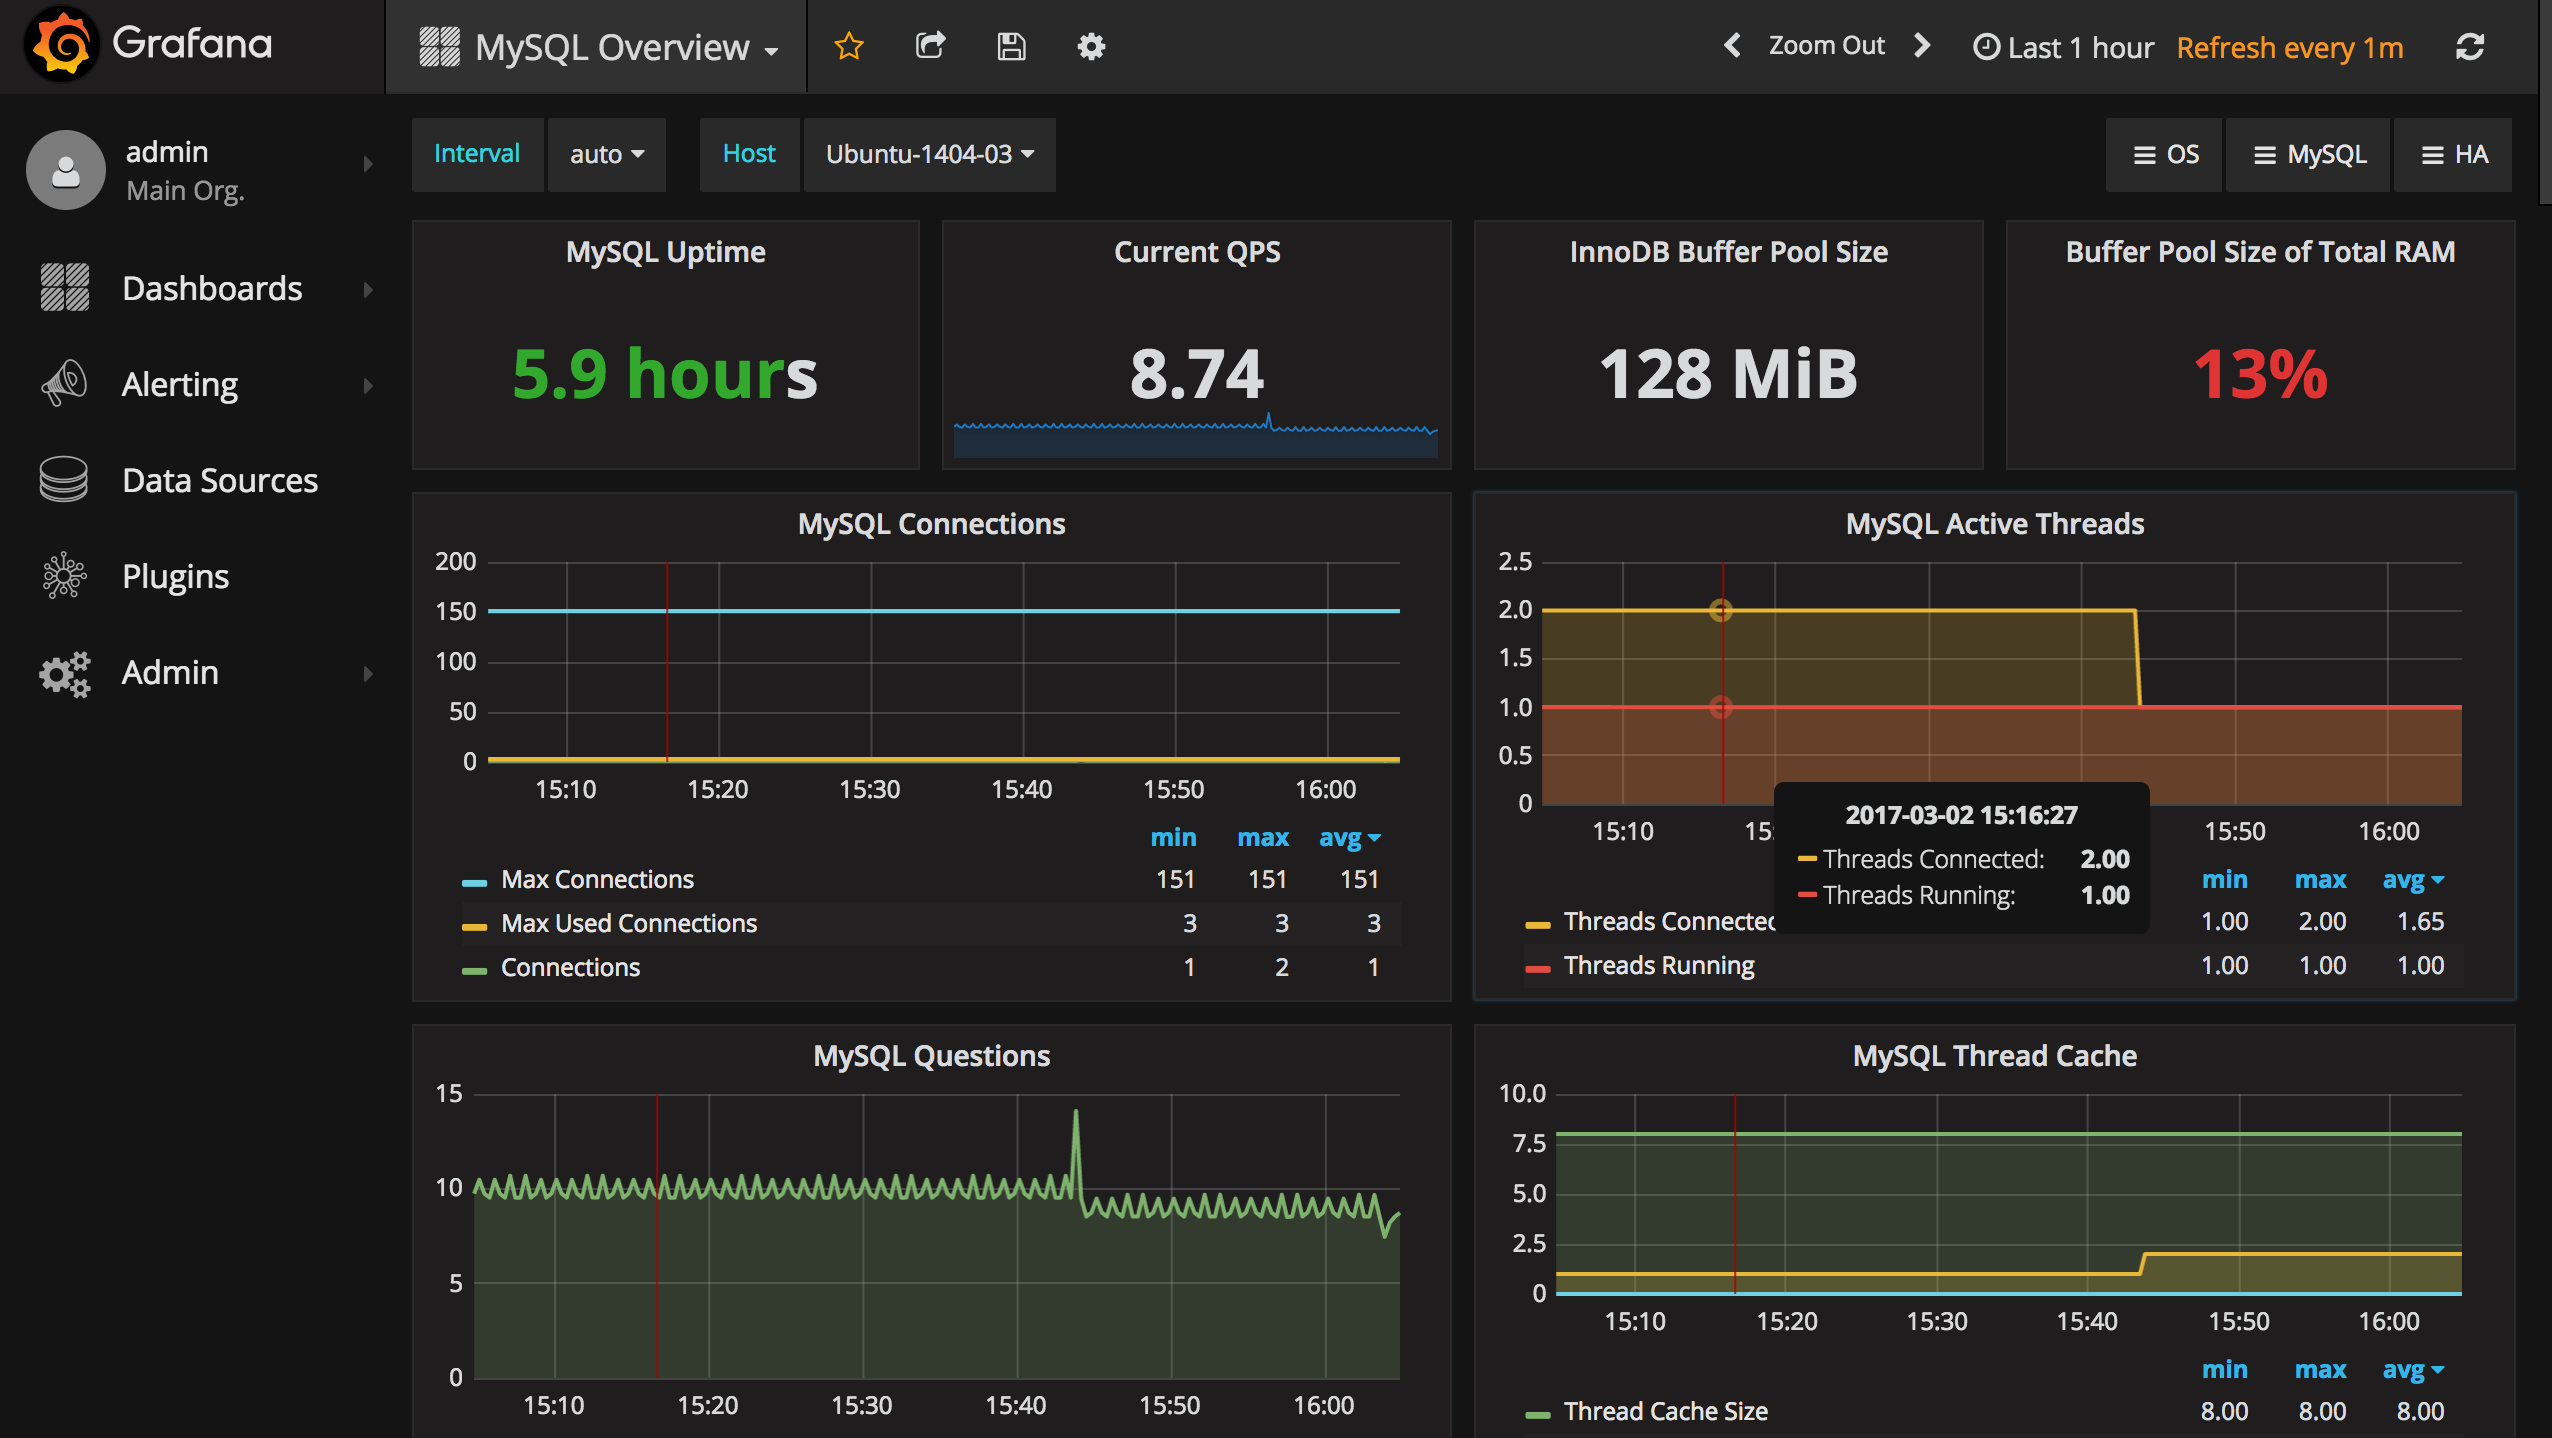
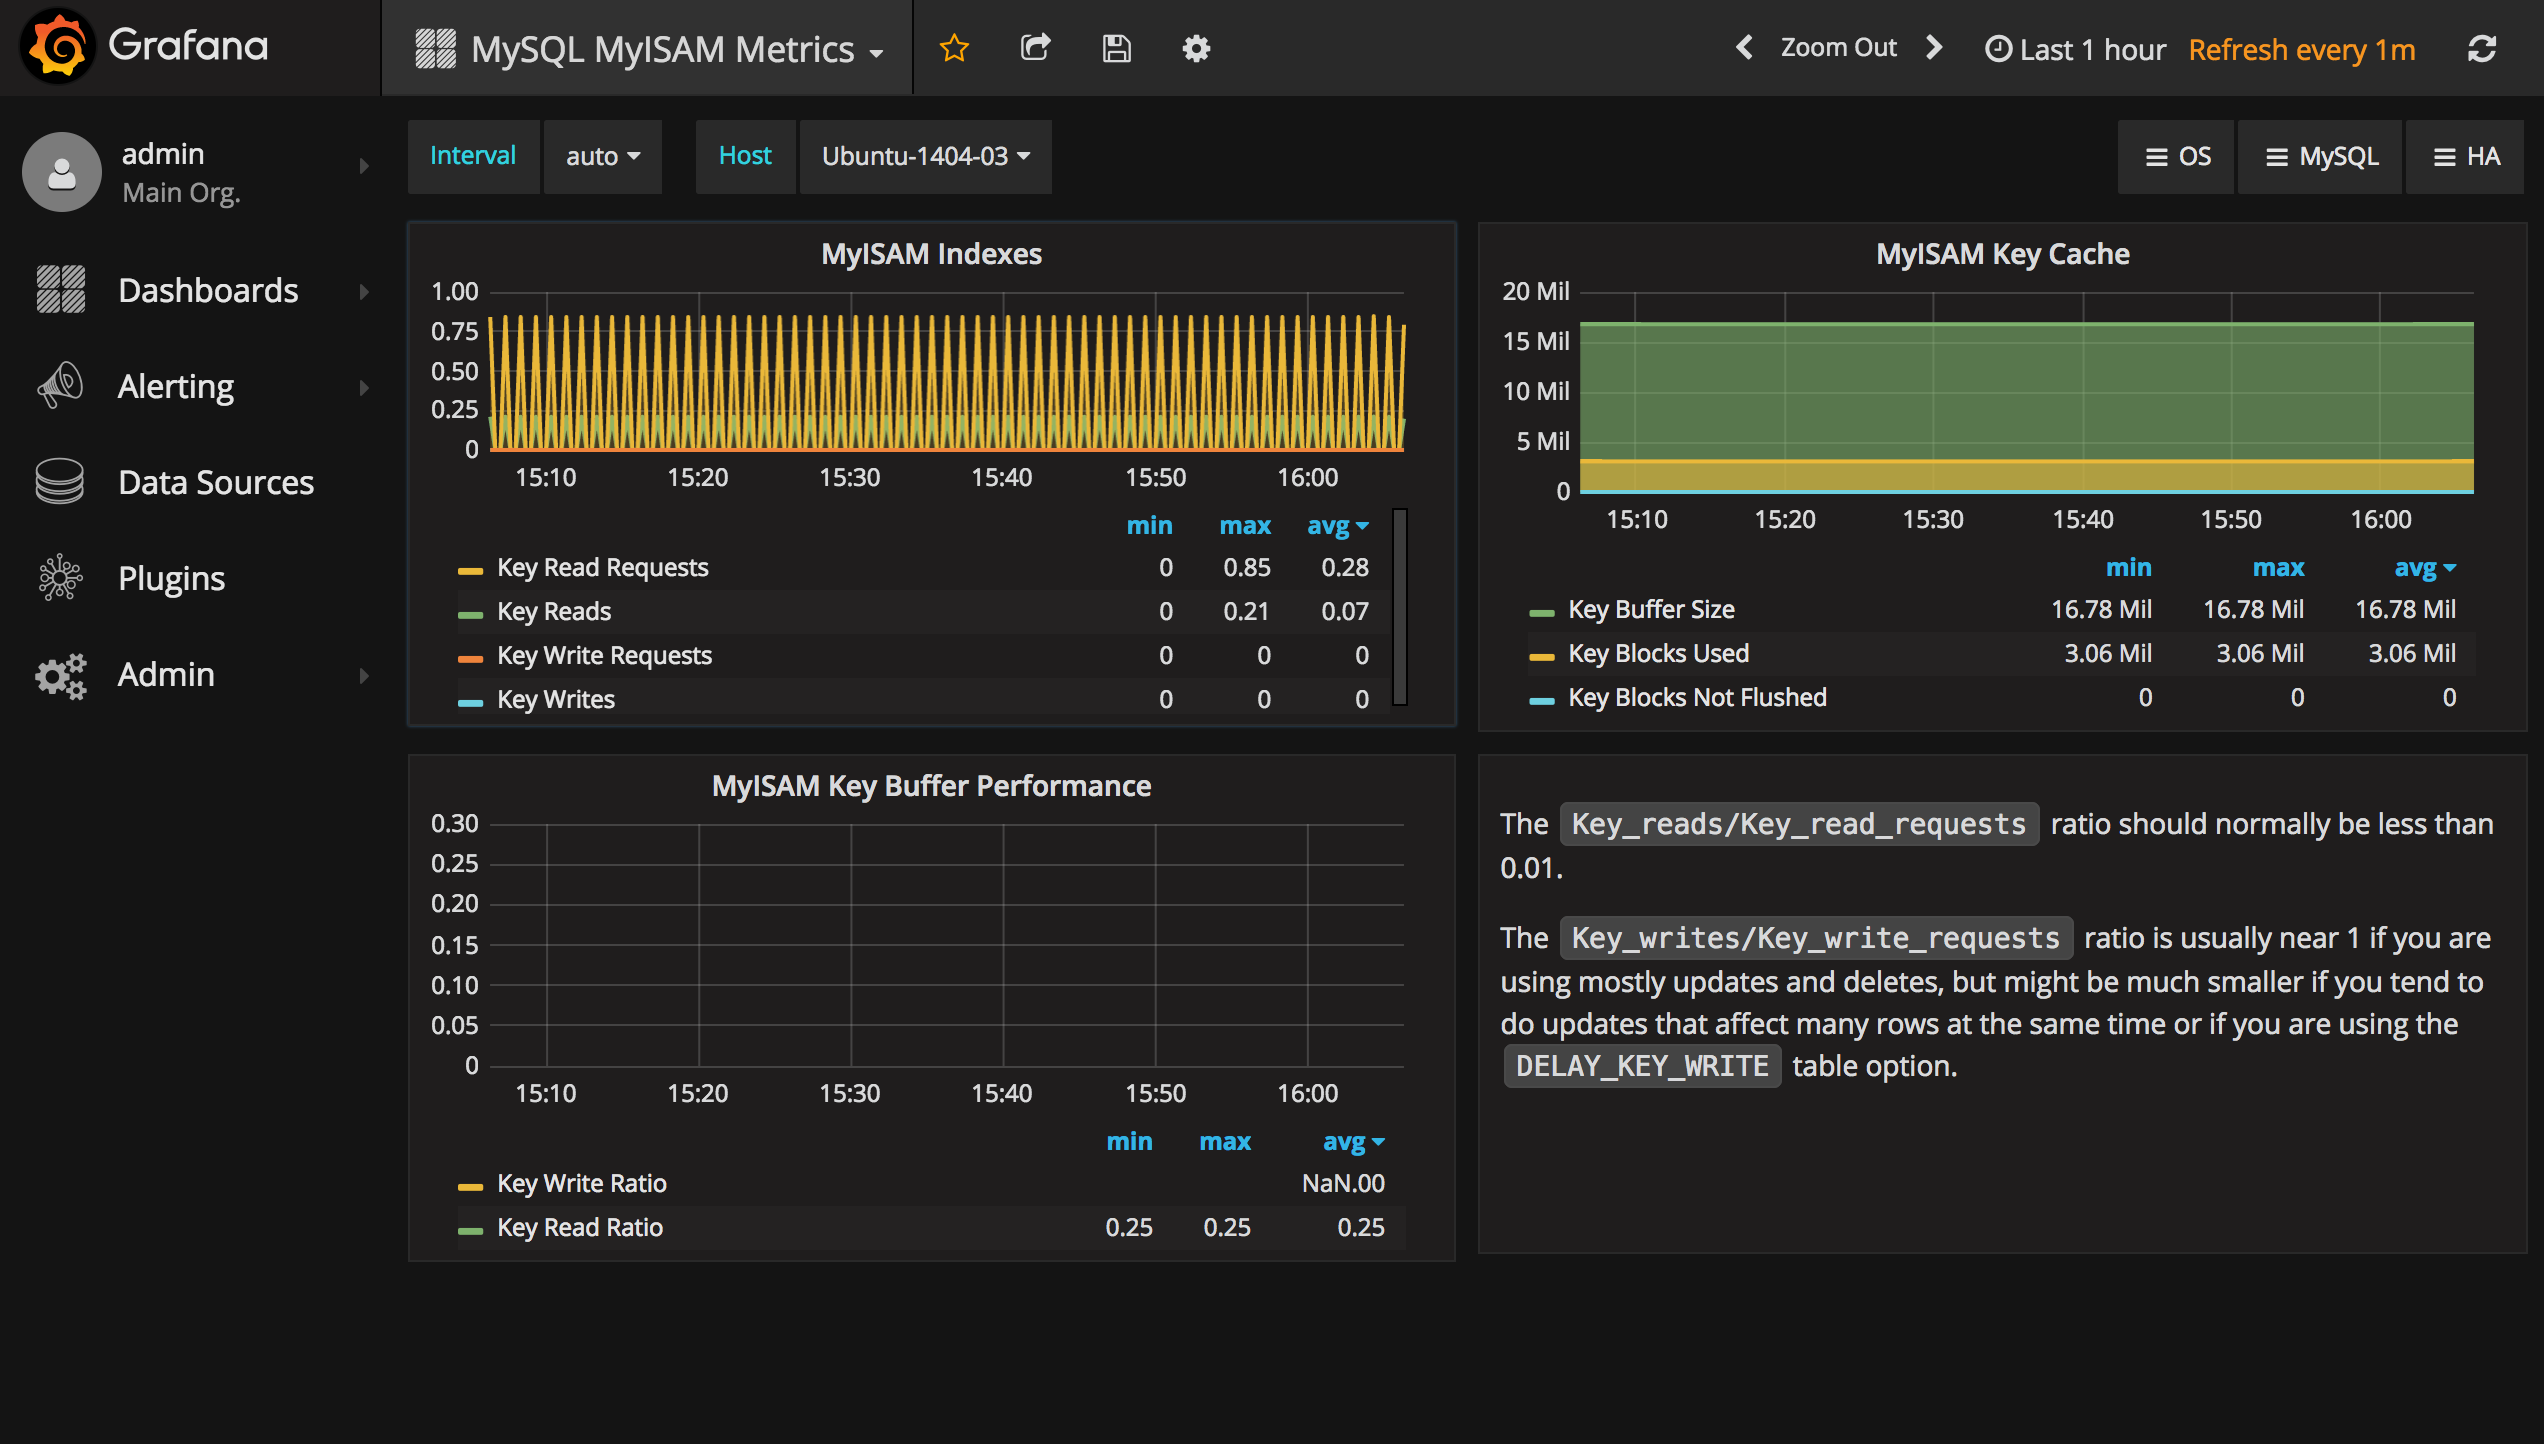
- MySQL
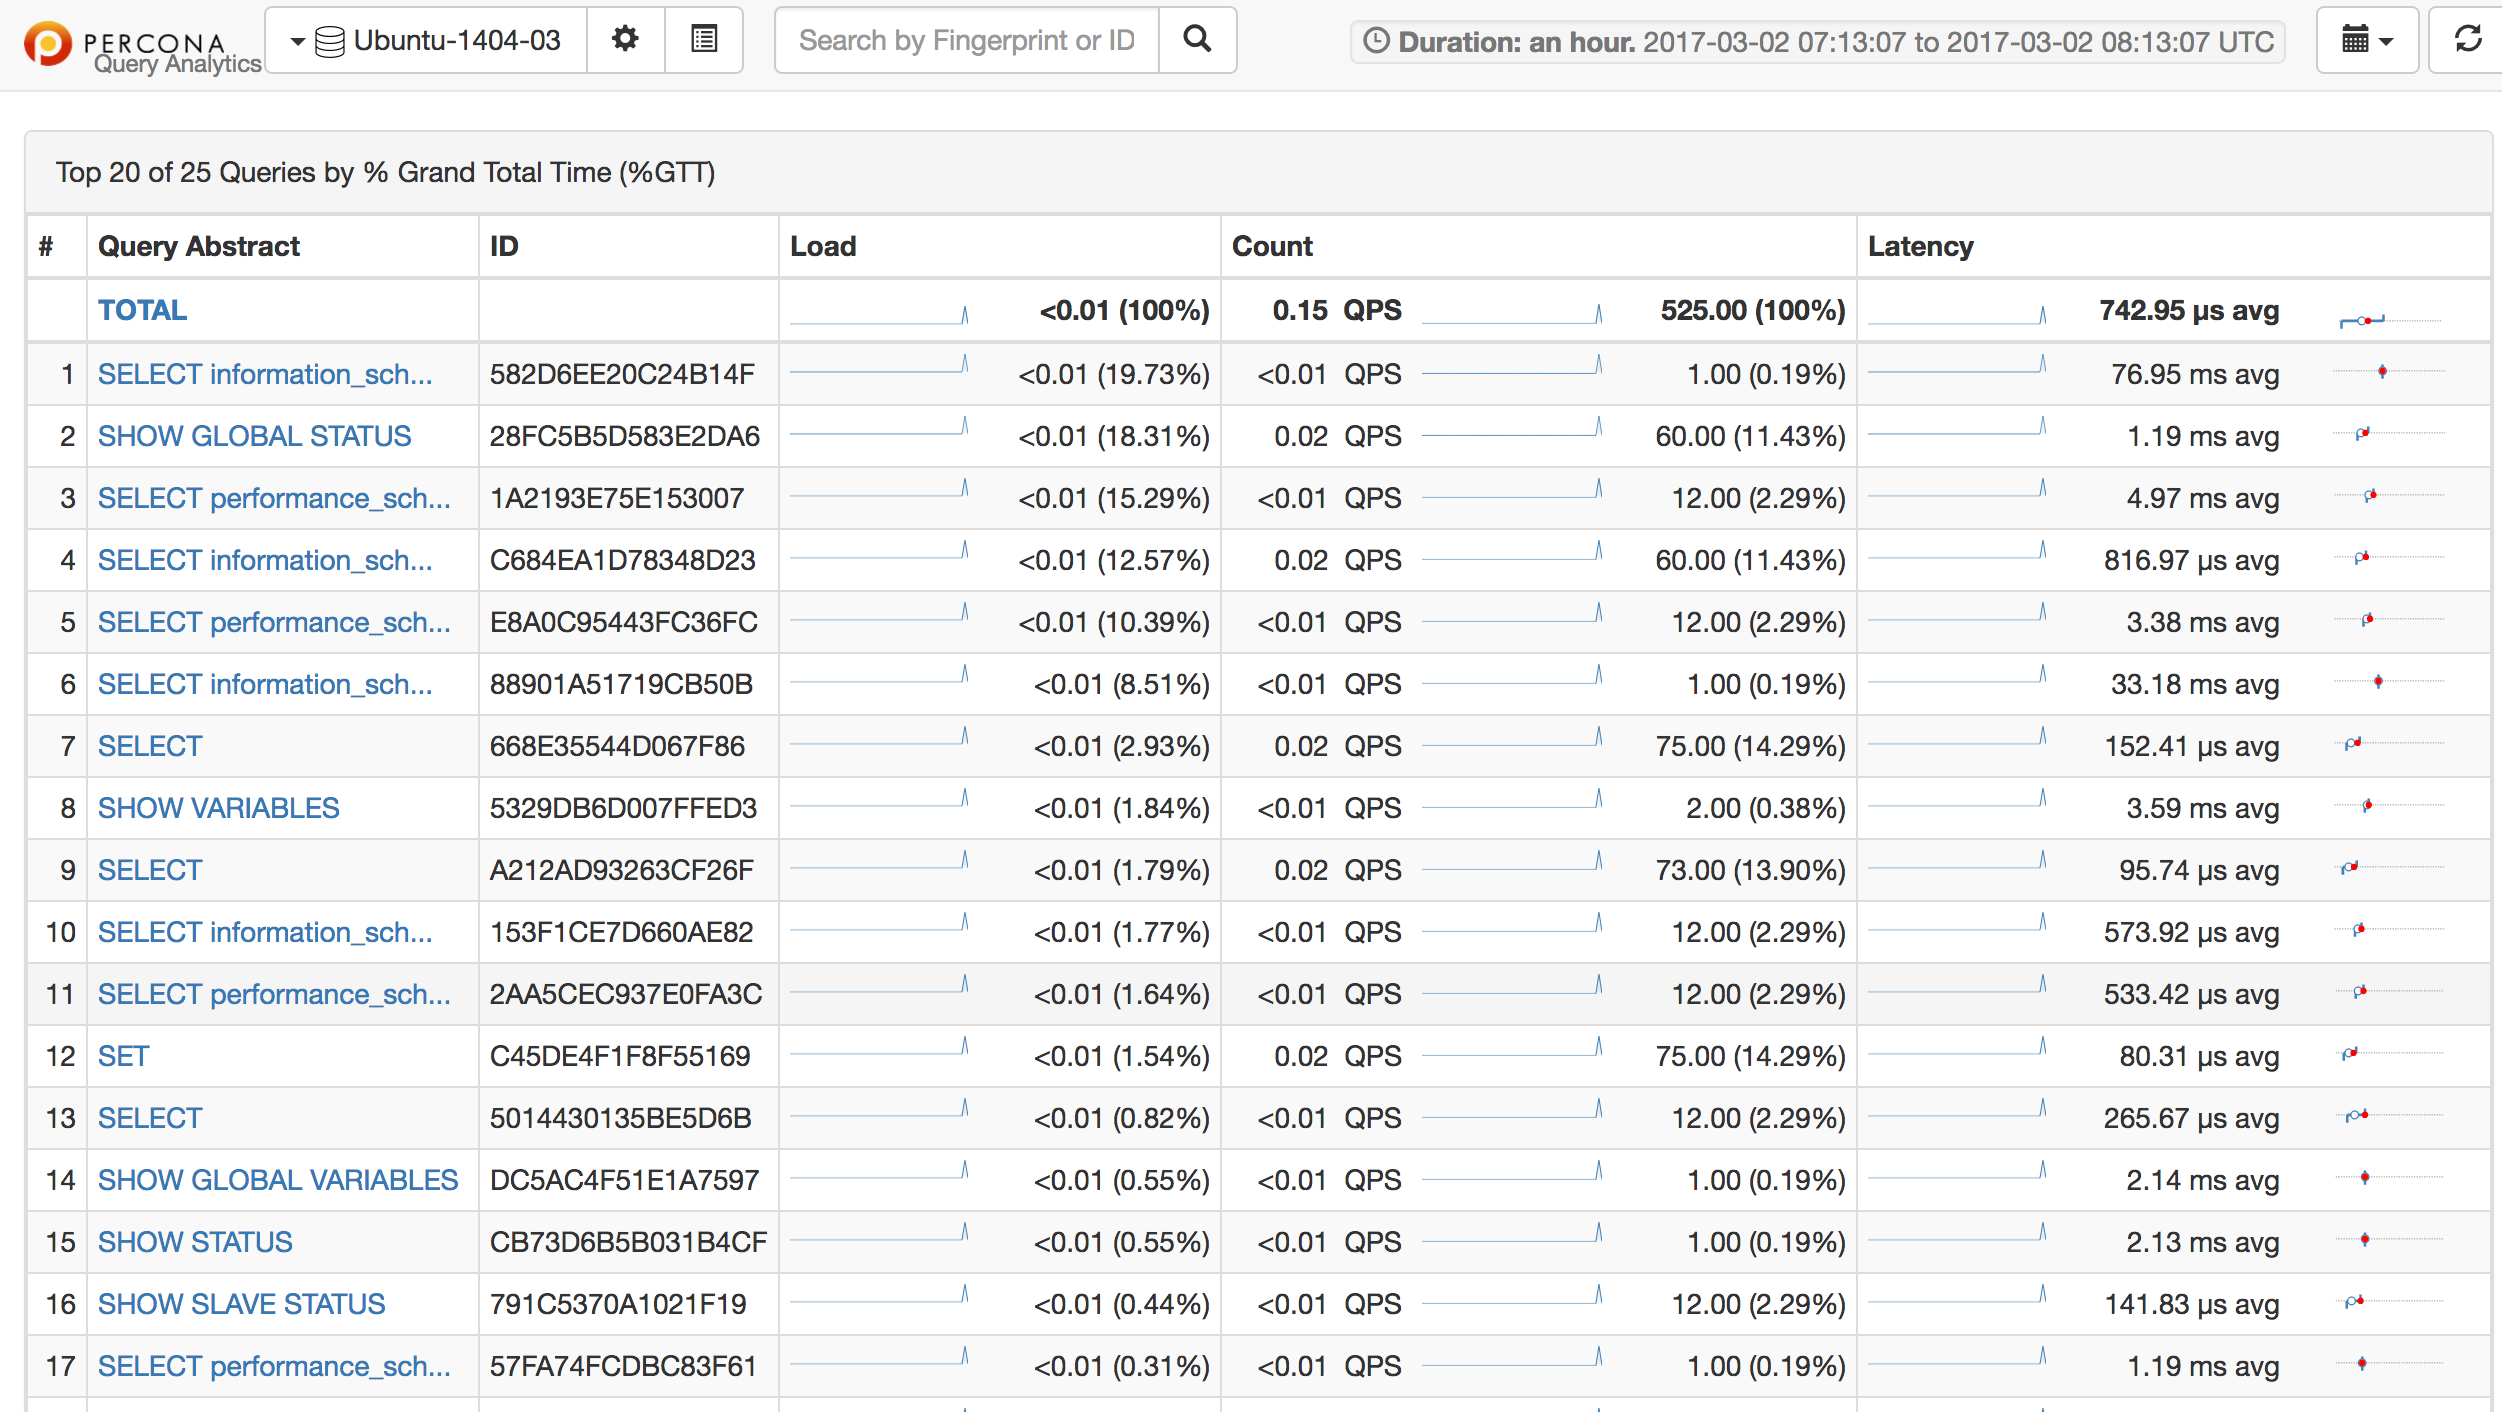
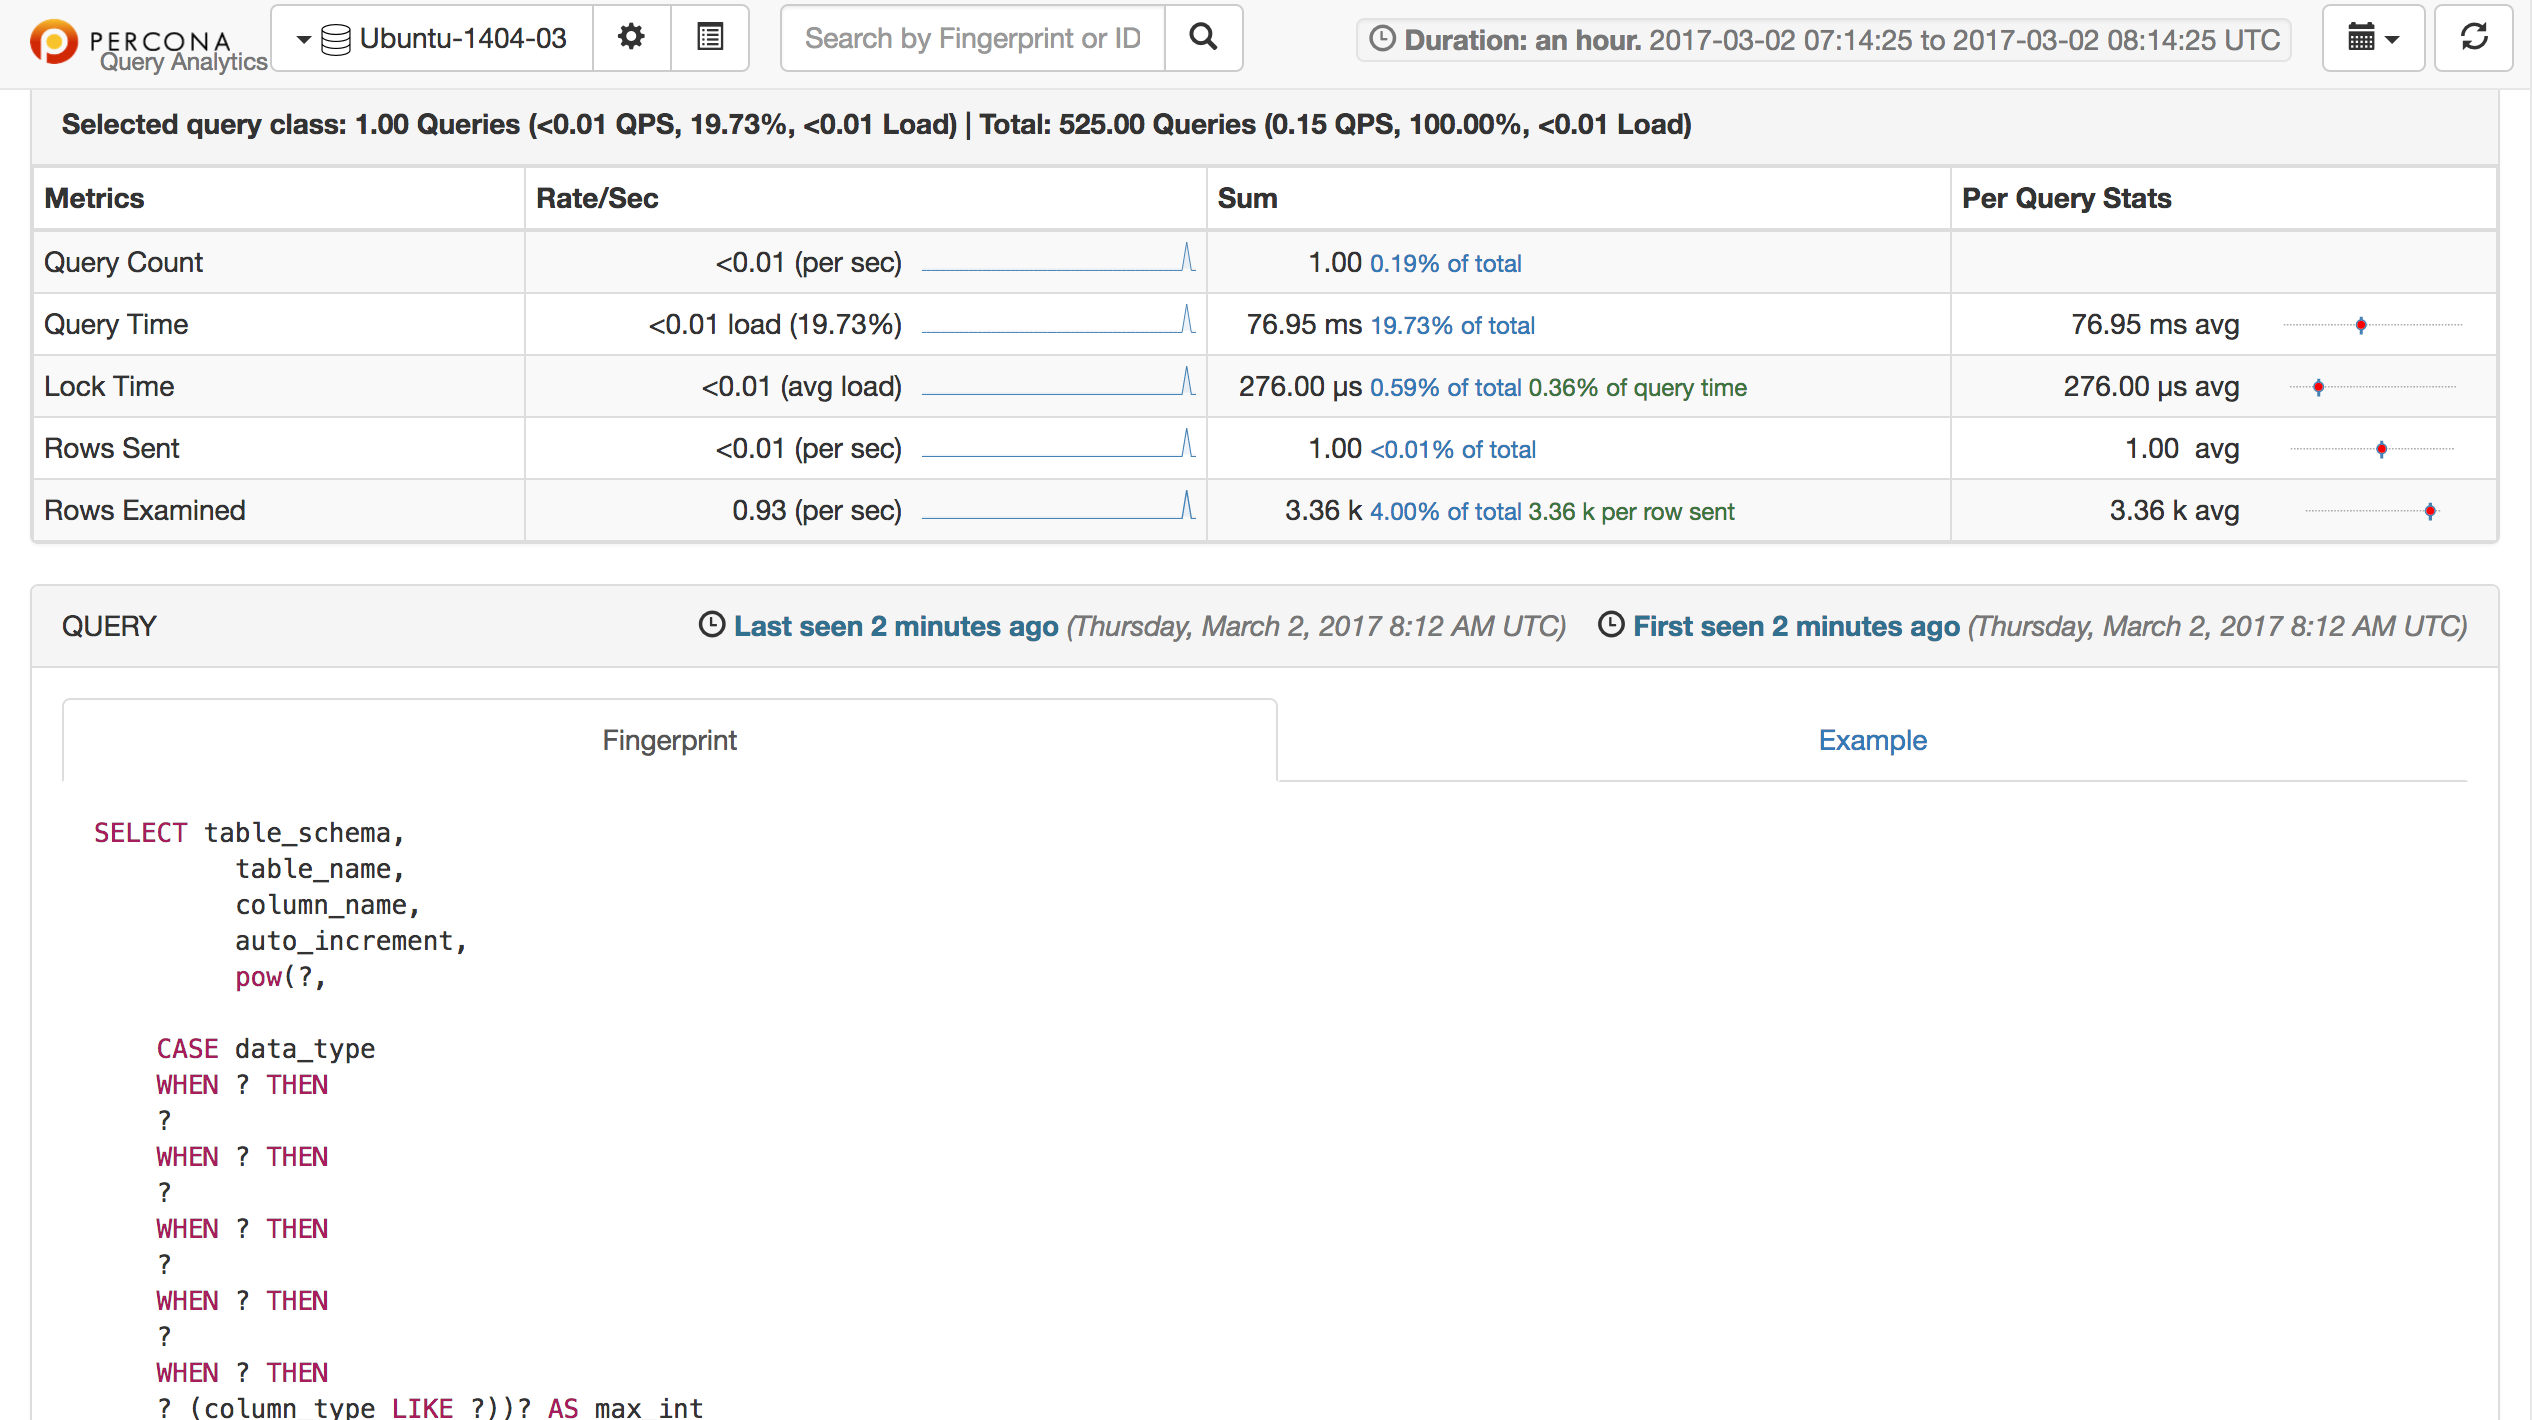
MySQL慢查询分析
常见错误
- 打开 PMM Query Analytics报 "QAN API error: "qh.Profile: No query classes for selected instance and time range.错误。
完整报错信息如下:
There is no data for the selected MySQL instance, time range or search query.
QAN API error: “qh.Profile: No query classes for selected instance and time range. Please check whether your MySQL settings match the recommended.”.
Check the /var/log/qan-api.log file in docker container for more information.
解决方法:PMM使用slow log作为查询源,需要开启慢日志。
1 | $ vim /etc/my.cnf |
- 打开Query Analytics翻看的时候我遇到了一个类似46191-error-agent-executable-file-not-found-in-path的错误。
解决方法:需要安装percona-toolkit包。
1 | $ apt-get install percona-toolkit |
参考文档
http://www.google.com
http://dbaplus.cn/news-21-1074-1.html
https://blog.yasking.org/tag/software.html
https://www.percona.com/doc/percona-monitoring-and-management/