Tsar简介
Tsar是淘宝自己开发的一个采集工具,主要用来收集服务器的系统信息(如cpu,io,mem,tcp等),以及应用数据(如squid haproxy nginx等)。
收集到的数据存储在磁盘上,可以随时查询历史信息,输出方式灵活多样,另外支持将数据存储到mysql中,也可以将数据发送到nagios报警服务器。
Tsar在展示数据时,可以指定模块,并且可以对多条信息的数据进行merge输出,带–live参数可以输出秒级的实时信息。
Tsar能够比较方便的增加模块,只需要按照tsar的要求编写数据的采集函数和展现函数,就可以把自定义的模块加入到Tsar中。
总体架构
Tsar是基于模块化设计的程序,程序有两部分组成:框架和模块。
框架程序源代码主要在src目录,而模块源代码主要在modules目录中。
框架提供对配置文件的解析,模块的加载,命令行参数的解析,应用模块的接口对模块原始数据的解析与输出。 模块提供接口给框架调用。
Tsar依赖与cron每分钟执行采集数据,因此它需要系统安装并启用crond,安装后,tsar每分钟会执行tsar --cron来定时采集信息,并且记录到原始日志文件。
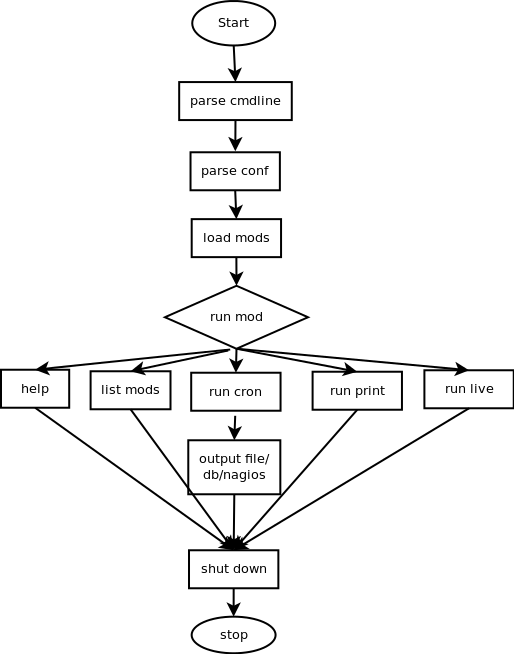
Tsar的运行流程图
主要执行流程
1.解析输入
2.读取配置文件信息
3.加载相应模块
4.tsar的三种运行模式
5.释放资源
项目地址: https://github.com/alibaba/tsar
Tsar安装 从github上检出代码
1
2
3
4
$ git clone git://github.com/alibaba/tsar.git $ cd tsar $ make $ make install
从github上下载源码
1
2
3
4
5
$ wget -O tsar.zip https://github.com/alibaba/tsar/archive/master.zip --no-check-certificate $ unzip tsar.zip $ cd tsar $ make $ make install
安装后生成的文件
Tsar配置文件路径:/etc/tsar/tsar.conf,tsar的采集模块和输出的具体配置;
Tsar配置 Tsar配置文件介绍
1
2
3
4
$ cat /etc/cron.d/tsar # cron tsar collect once per minute MAILTO="" * * * * * root /usr/bin/tsar --cron > /dev/null 2>&1
如上所示,/etc/cron.d/tsar里面负责每分钟以root用户的角色调用tsar命令来执行数据采集。
1
2
3
4
5
6
7
8
9
10
11
12
13
14
15
16
$ cat /etc/logrotate.d/tsar /var/log/tsar.data { monthly rotate 120 create nocompress nodateext notifempty prerotate /usr/bin/chattr -a /var/log/tsar.data endscript postrotate /usr/bin/chattr +a /var/log/tsar.data endscript }
在日志文件轮转配置中,每个月会把tsar的本地存储进行轮转,此外这里也设定了数据在/var/log/tsar.data下
/etc/tsar/tsar.conf负责tsar的采集模块和输出的具体配置;在这里配置启用哪些模块,输出等内容。
1
2
3
4
5
6
7
8
9
10
11
12
13
14
15
16
17
18
19
20
21
22
23
24
25
26
27
28
29
30
31
32
33
34
35
36
37
38
39
40
41
42
43
44
45
46
47
48
49
50
51
52
53
54
55
56
57
58
59
60
61
62
63
64
65
66
67
68
69
70
71
72
73
74
75
76
77
$ cat /etc/tsar/tsar.conf ####debug_level(INFO DEBUG WARN ERROR FATAL) debug_level ERROR ####[module] mod_cpu on mod_mem on mod_swap on mod_tcp on mod_udp on mod_traffic on mod_io on mod_pcsw on mod_partition on mod_tcpx on mod_load on mod_apache off mod_lvs off mod_haproxy off mod_squid off mod_nginx off mod_nginx_multiport off mod_nginx_live off #mod_nginx_sys_mport on 80 8080 mod_swift off mod_swift_code off mod_swift_domain off mod_swift_esi off mod_swift_fwd off mod_swift_store off mod_swift_swapdir off mod_swift_purge off mod_swift_sys off mod_swift_tcmalloc off mod_tmd off mod_percpu off mod_tcprt off mod_proc off pidname mod_pharos off mod_tmd4 off mod_keyserver off #mod_erpc on /etc/tsar/erpc.conf #mod_search on ####output_interface file,db,nagios output_interface file ####[output_file] original data to store output_file_path /var/log/tsar.data ####[output_stdio] these mod will be show as using tsar command output_stdio_mod mod_swap,mod_partition,mod_cpu,mod_mem,mod_lvs,mod_haproxy,mod_traffic,mod_squid,mod_load,mod_tcp,mod_udp,mod_tcpx,mod_apache,mod_pcsw,mod_io,mod_percpu ####[output_db] #output_db_mod mod_swap,mod_partition,mod_cpu,mod_mem,mod_traffic,mod_load,mod_tcp,mod_udp,mod_pcsw,mod_io #output_db_addr console2:56677 ####[output_tcp] #output_tcp_mod mod_swap,mod_cpu #output_tcp_addr localhost:9666 #output_tcp_merge on ####support include other mod conf include /etc/tsar/conf.d/*.conf ####The IP address or the host running the NSCA daemon #server_addr nagios.server.com ####The port on which the daemon is running - default is 5667 #server_port 8086 ####The cycle of send alert to nagios #cycle_time 300 ####nsca client program #send_nsca_cmd /usr/bin/send_nsca #send_nsca_conf /home/a/conf/amon/send_nsca.conf ####tsar mod alert config file ####threshold servicename.key;w-min;w-max;c-min;cmax; #threshold cpu.util;N;N;N;N;
常用参数说明
debug_level 指定tsar的运行级别,主要用来调试使用
/etc/tsar/conf.d/这个目录下是用户的自定义模块配置文件,配置基本在用户开发自定义模块时确定,主要包含模块的开启,输出类型和报警范围
Tsar使用介绍 在Tsar的使用中,可以参考下面的帮助信息,完成对应的监控。
1
2
3
4
5
6
7
8
9
10
11
12
13
14
15
16
17
18
19
20
21
22
23
24
25
26
27
28
29
30
$ tsar -h Usage: tsar [options] Options: -check 查看最后一次的采集数据 --check/-C 查看最后一次tsar的提醒信息,如:tsar --check / tsar --check --cpu --io --cron/-c 使用crond模式来进行tsar监控 --interval/-i 指明tsar的间隔时间,默认单位分钟,默认显示间隔5分钟;带上--live参数则单位是秒,默认是5秒。 --list/-L 列出启用的模块 --live/-l 启用实时模式,类似iostat等,可以配合-i参数和模块参数使用。 --file/-f 指定输入文件 --ndays/-n 控制显示多长时间的历史数据,默认1天 --date/-d 指定日期,YYYYMMDD或者n代表n天前 --detail/-D 能够指定查看主要字段还是模块的所有字段 --spec/-s 指定字段,tsar –cpu -s sys,util --watch/-w 显示最后多少分钟的记录. 如:tsar --watch 30 / tsar --watch 30 --cpu --io --merge/-m 对有多个数据的展示,进行汇总,如机器上跑了3个squid,可以用 tsar –squid -m的放式进行展示汇总。 --item/-I 显示指定项目数据, 如:tsar --io -I sda -–help/-h 显示提示信息和模块信息 Modules Enabled: --cpu 列出cpu相关的监控计数 --mem 物理内存的使用情况 --swap 虚拟内存的使用情况 --tcp TCP协议IPV4的使用情况 --udp UDP协议IPV4的使用情况 --traffic 网络传出的使用情况 --io Linux IO的情况 --pcsw 进程和上下文切换 --partition 磁盘使用情况 --tcpx TCP连接相关的数据参数 --load 系统负载情况
tsar命令行主要担负显示历史数据和实时数据的功能,因此有控制展示模块和格式化输出的参数,默认不带任何参数/选项的情况下,tsar打印汇总信息。
tsar命令行主要显示给人看的,所以数据展示中都进行了k/m/g等的进位。
tsar命令会在显示20行数据后再次打印各个列的列头,以利于用户理解数据的含义。
tsar的列头信息包括2行,第一行为模块名,第二行为列名。
tsar输出最后会作min/avg/max的汇总统计,统计所展示中的最小/平均/最大数据。
Tsar使用实例 Tsar监控系统 查看可用的模块列表
1
2
3
4
5
6
7
8
9
10
11
12
13
$ tsar -L tsar enable follow modules: cpu mem swap tcp udp traffic io pcsw partition tcpx load
查看指定模块的运行状况,模块是指tsar -L列出来的名称。如查看CPU运行情况
1
2
3
4
5
6
7
8
9
10
11
12
13
14
15
16
17
18
19
20
21
22
23
24
25
26
27
28
29
30
31
32
33
34
35
$ tsar --cpu Time -----------------------cpu---------------------- Time user sys wait hirq sirq util 18/05/16-09:20 0.03 0.08 0.01 0.00 0.02 0.12 18/05/16-09:25 0.00 0.02 0.00 0.00 0.01 0.04 18/05/16-09:30 0.00 0.02 0.00 0.00 0.02 0.05 18/05/16-09:35 0.00 0.87 2.06 0.00 0.02 0.90 18/05/16-09:40 0.00 0.03 0.00 0.00 0.02 0.05 18/05/16-09:45 0.00 0.02 0.00 0.00 0.02 0.04 18/05/16-09:50 0.00 0.02 0.00 0.00 0.02 0.04 18/05/16-09:55 0.01 0.02 0.00 0.00 0.02 0.05 18/05/16-10:00 0.00 0.02 0.00 0.00 0.02 0.05 18/05/16-10:05 0.07 0.16 0.00 0.00 0.02 0.24 18/05/16-10:10 0.12 0.32 0.04 0.00 0.02 0.46 18/05/16-10:15 0.02 0.09 0.00 0.00 0.02 0.13 18/05/16-10:20 0.04 0.15 0.00 0.00 0.02 0.20 18/05/16-10:25 0.03 0.07 0.00 0.00 0.02 0.11 18/05/16-10:30 0.01 0.03 0.00 0.00 0.02 0.05 18/05/16-10:35 0.00 0.02 0.00 0.00 0.02 0.04 18/05/16-10:40 0.01 0.03 0.00 0.00 0.02 0.05 18/05/16-10:45 0.00 0.02 0.00 0.00 0.02 0.05 18/05/16-10:50 0.00 0.03 0.00 0.00 0.02 0.05 Time -----------------------cpu---------------------- Time user sys wait hirq sirq util 18/05/16-10:55 0.07 0.10 0.00 0.00 0.02 0.19 18/05/16-11:00 0.02 0.07 0.00 0.00 0.02 0.10 18/05/16-11:05 0.02 0.05 0.00 0.00 0.01 0.09 18/05/16-11:10 0.01 0.03 0.00 0.00 0.01 0.06 18/05/16-11:15 0.01 0.03 0.00 0.00 0.01 0.05 18/05/16-11:20 0.01 0.03 0.00 0.00 0.02 0.06 18/05/16-11:25 0.01 0.03 0.00 0.00 0.01 0.05 MAX 0.03 0.87 2.06 0.00 0.02 0.90 MEAN 0.02 0.09 0.08 0.00 0.02 0.13 MIN 0.03 0.08 0.01 0.00 0.02 0.12
查看实时数据
1
2
3
4
5
6
7
8
9
10
11
12
$ tsar -l Time ---cpu-- ---mem-- ---tcp-- -----traffic---- --sda--- --dm-0-- --dm-1-- --dm-2-- ---load- Time util util retran bytin bytout util util util util load1 18/05/16-11:27:47 0.05 33.16 0.00 24.00 74.00 0.04 0.04 0.00 0.00 0.00 18/05/16-11:27:52 0.05 33.15 0.00 30.00 52.00 0.06 0.06 0.00 0.00 0.00 18/05/16-11:27:57 0.20 33.15 0.00 12.00 40.00 0.02 0.02 0.00 0.00 0.00 18/05/16-11:28:02 0.50 33.18 0.00 12.00 40.00 0.00 0.00 0.00 0.00 0.00 18/05/16-11:28:07 0.15 33.18 0.00 85.00 40.00 0.04 0.04 0.00 0.00 0.00 18/05/16-11:28:12 0.15 33.18 0.00 159.00 40.00 0.00 0.00 0.00 0.00 0.00 18/05/16-11:28:17 0.05 33.18 0.00 12.00 40.00 0.06 0.06 0.00 0.00 0.00 18/05/16-11:28:22 0.10 33.18 0.00 24.00 52.00 0.00 0.00 0.00 0.00 0.00 18/05/16-11:28:27 0.15 33.17 0.00 48.00 40.00 0.00 0.00 0.00 0.00 0.00
显示1天内的历史汇总(summury)信息,以默认5分钟为间隔
1
2
3
4
5
6
7
8
9
10
11
12
13
14
15
16
17
18
19
20
21
22
23
24
25
26
27
28
29
30
31
32
33
34
35
$ tsar Time ---cpu-- ---mem-- ---tcp-- -----traffic---- --sda--- --dm-0-- --dm-1-- --dm-2-- ---load- Time util util retran bytin bytout util util util util load1 18/05/16-09:20 0.12 24.61 0.00 42.00 33.00 0.07 0.07 0.00 0.00 0.00 18/05/16-09:25 0.04 24.58 0.00 12.00 2.00 0.03 0.03 0.00 0.00 0.00 18/05/16-09:30 0.05 24.62 0.00 6.00 3.00 0.03 0.03 0.00 0.00 0.00 18/05/16-09:35 0.90 32.99 0.00 3.00 2.00 11.16 11.05 0.00 0.11 0.35 18/05/16-09:40 0.05 32.98 0.00 8.00 2.00 0.14 0.14 0.00 0.00 0.00 18/05/16-09:45 0.04 32.98 0.00 16.00 2.00 0.01 0.01 0.00 0.00 0.00 18/05/16-09:50 0.04 33.03 0.00 11.00 3.00 0.03 0.03 0.00 0.00 0.00 18/05/16-09:55 0.05 32.95 0.00 8.00 2.00 0.03 0.03 0.00 0.00 0.00 18/05/16-10:00 0.05 33.00 0.00 9.00 2.00 0.02 0.02 0.00 0.00 0.00 18/05/16-10:05 0.24 33.00 0.00 77.00 167.00 0.05 0.05 0.00 0.00 0.00 18/05/16-10:10 0.46 33.50 0.00 146.00 377.00 0.23 0.23 0.00 0.00 0.00 18/05/16-10:15 0.13 33.01 0.00 31.00 60.00 0.04 0.04 0.00 0.00 0.00 18/05/16-10:20 0.20 33.03 0.00 51.00 120.00 0.05 0.05 0.00 0.00 0.00 18/05/16-10:25 0.11 33.01 0.00 27.00 26.00 0.04 0.04 0.00 0.00 0.01 18/05/16-10:30 0.05 33.04 0.00 2.00 3.00 0.02 0.02 0.00 0.00 0.00 18/05/16-10:35 0.04 32.99 0.00 10.00 2.00 0.01 0.01 0.00 0.00 0.00 18/05/16-10:40 0.05 33.03 0.00 22.00 2.00 0.02 0.02 0.00 0.00 0.00 18/05/16-10:45 0.05 33.00 0.00 10.00 3.00 0.03 0.03 0.00 0.00 0.00 18/05/16-10:50 0.05 33.01 0.00 16.00 3.00 0.02 0.02 0.00 0.00 0.00 Time ---cpu-- ---mem-- ---tcp-- -----traffic---- --sda--- --dm-0-- --dm-1-- --dm-2-- ---load- Time util util retran bytin bytout util util util util load1 18/05/16-10:55 0.19 33.02 0.00 45.00 63.00 0.02 0.02 0.00 0.00 0.00 18/05/16-11:00 0.10 33.04 0.00 21.00 30.00 0.02 0.02 0.00 0.00 0.00 18/05/16-11:05 0.09 33.01 0.00 32.00 23.00 0.03 0.03 0.00 0.00 0.00 18/05/16-11:10 0.06 33.04 0.00 14.00 3.00 0.01 0.01 0.00 0.00 0.01 18/05/16-11:15 0.05 33.02 0.00 12.00 2.00 0.01 0.01 0.00 0.00 0.00 18/05/16-11:20 0.06 33.03 0.00 10.00 2.00 0.04 0.04 0.00 0.00 0.03 18/05/16-11:25 0.05 33.03 0.00 7.00 2.00 0.01 0.01 0.00 0.00 0.03 MAX 0.90 33.50 0.00 146.00 377.00 11.16 11.05 0.00 0.11 0.35 MEAN 0.13 32.36 0.00 24.24 36.24 0.48 0.48 0.00 0.00 0.02 MIN 0.12 24.61 0.00 2.00 2.00 0.07 0.07 0.00 0.00 0.00
以1秒钟为间隔,实时打印tsar的概述数据
1
2
3
4
5
6
7
8
9
10
11
12
13
14
15
$ tsar -i 1 -l Time ---cpu-- ---mem-- ---tcp-- -----traffic---- --sda--- --dm-0-- --dm-1-- --dm-2-- ---load- Time util util retran bytin bytout util util util util load1 18/05/16-10:17:17 0.25 33.13 0.00 60.00 314.00 0.00 0.00 0.00 0.00 0.00 18/05/16-10:17:18 0.00 33.13 0.00 60.00 202.00 0.50 0.50 0.00 0.00 0.00 18/05/16-10:17:19 0.49 33.13 0.00 60.00 202.00 0.00 0.00 0.00 0.00 0.00 18/05/16-10:17:21 0.00 33.13 0.00 60.00 202.00 0.00 0.00 0.00 0.00 0.00 18/05/16-10:17:22 0.49 33.13 0.00 60.00 202.00 0.00 0.00 0.00 0.00 0.00 18/05/16-10:17:23 0.25 33.13 0.00 120.00 262.00 0.20 0.20 0.00 0.00 0.00 18/05/16-10:17:24 0.25 33.13 0.00 60.00 202.00 0.40 0.40 0.00 0.00 0.00 18/05/16-10:17:25 0.00 33.13 0.00 60.00 202.00 0.00 0.00 0.00 0.00 0.00 18/05/16-10:17:26 0.00 33.13 0.00 60.00 202.00 0.00 0.00 0.00 0.00 0.00 18/05/16-10:17:27 0.49 33.13 0.00 60.00 202.00 0.00 0.00 0.00 0.00 0.00 18/05/16-10:17:28 0.25 33.13 0.00 60.00 202.00 0.00 0.00 0.00 0.00 0.00 18/05/16-10:17:29 0.25 33.13 0.00 60.00 202.00 0.00 0.00 0.00 0.00 0.00
tsar cpu监控
使用参数-–cpu可以监控系统的cpu,参数user表示用户空间cpu, sys内核空间cpu使用情况,wait是IO对应的cpu使用情况,hirq,sirq分别是硬件中断,软件中断的使用情况,util是系统使用cpu的总计情况。
1
2
3
4
5
6
7
8
9
10
11
12
13
14
15
16
17
18
19
20
21
22
23
24
25
26
27
28
29
30
31
32
33
34
35
$ tsar --cpu Time -----------------------cpu---------------------- Time user sys wait hirq sirq util 18/05/16-09:20 0.03 0.08 0.01 0.00 0.02 0.12 18/05/16-09:25 0.00 0.02 0.00 0.00 0.01 0.04 18/05/16-09:30 0.00 0.02 0.00 0.00 0.02 0.05 18/05/16-09:35 0.00 0.87 2.06 0.00 0.02 0.90 18/05/16-09:40 0.00 0.03 0.00 0.00 0.02 0.05 18/05/16-09:45 0.00 0.02 0.00 0.00 0.02 0.04 18/05/16-09:50 0.00 0.02 0.00 0.00 0.02 0.04 18/05/16-09:55 0.01 0.02 0.00 0.00 0.02 0.05 18/05/16-10:00 0.00 0.02 0.00 0.00 0.02 0.05 18/05/16-10:05 0.07 0.16 0.00 0.00 0.02 0.24 18/05/16-10:10 0.12 0.32 0.04 0.00 0.02 0.46 18/05/16-10:15 0.02 0.09 0.00 0.00 0.02 0.13 18/05/16-10:20 0.04 0.15 0.00 0.00 0.02 0.20 18/05/16-10:25 0.03 0.07 0.00 0.00 0.02 0.11 18/05/16-10:30 0.01 0.03 0.00 0.00 0.02 0.05 18/05/16-10:35 0.00 0.02 0.00 0.00 0.02 0.04 18/05/16-10:40 0.01 0.03 0.00 0.00 0.02 0.05 18/05/16-10:45 0.00 0.02 0.00 0.00 0.02 0.05 18/05/16-10:50 0.00 0.03 0.00 0.00 0.02 0.05 Time -----------------------cpu---------------------- Time user sys wait hirq sirq util 18/05/16-10:55 0.07 0.10 0.00 0.00 0.02 0.19 18/05/16-11:00 0.02 0.07 0.00 0.00 0.02 0.10 18/05/16-11:05 0.02 0.05 0.00 0.00 0.01 0.09 18/05/16-11:10 0.01 0.03 0.00 0.00 0.01 0.06 18/05/16-11:15 0.01 0.03 0.00 0.00 0.01 0.05 18/05/16-11:20 0.01 0.03 0.00 0.00 0.02 0.06 18/05/16-11:25 0.01 0.03 0.00 0.00 0.01 0.05 MAX 0.03 0.87 2.06 0.00 0.02 0.90 MEAN 0.02 0.09 0.08 0.00 0.02 0.13 MIN 0.03 0.08 0.01 0.00 0.02 0.12
显示一天内的cpu和内存历史数据,以1分钟为间隔
1
2
3
4
5
6
7
8
9
10
11
12
13
14
15
16
17
18
19
20
21
22
$ tsar --cpu --mem -i 1 Time -----------------------cpu---------------------- -----------------------mem---------------------- Time user sys wait hirq sirq util free used buff cach total util 18/05/16-09:14 0.00 0.02 0.00 0.00 0.01 0.04 1.2G 456.9M 35.9M 95.8M 1.8G 24.54 18/05/16-09:15 0.01 0.02 0.00 0.00 0.02 0.05 1.2G 456.9M 35.9M 95.8M 1.8G 24.53 18/05/16-09:16 0.00 0.02 0.00 0.00 0.01 0.04 1.2G 456.8M 36.0M 95.8M 1.8G 24.53 18/05/16-09:17 0.01 0.03 0.00 0.00 0.02 0.06 1.2G 456.6M 36.0M 95.8M 1.8G 24.52 18/05/16-09:18 0.19 0.46 0.08 0.00 0.02 0.67 1.2G 458.8M 36.7M 95.8M 1.8G 24.64 18/05/16-09:19 0.00 0.03 0.00 0.00 0.02 0.05 1.2G 457.9M 36.8M 95.8M 1.8G 24.59 18/05/16-09:20 0.00 0.02 0.00 0.00 0.02 0.05 1.2G 458.3M 36.8M 95.8M 1.8G 24.61 18/05/16-09:21 0.00 0.02 0.00 0.00 0.01 0.04 1.2G 457.8M 36.8M 95.8M 1.8G 24.58 18/05/16-09:22 0.01 0.02 0.00 0.00 0.02 0.05 1.2G 457.5M 36.8M 95.8M 1.8G 24.57 18/05/16-09:23 0.00 0.03 0.00 0.00 0.02 0.05 1.2G 457.6M 36.9M 95.8M 1.8G 24.57 18/05/16-09:24 0.00 0.02 0.00 0.00 0.02 0.05 1.2G 457.7M 36.9M 95.8M 1.8G 24.58 18/05/16-09:25 0.00 0.02 0.00 0.00 0.01 0.04 1.2G 457.7M 36.9M 95.8M 1.8G 24.58 18/05/16-09:26 0.00 0.02 0.00 0.00 0.02 0.05 1.2G 457.7M 36.9M 95.9M 1.8G 24.58 18/05/16-09:27 0.01 0.03 0.00 0.00 0.02 0.06 1.2G 457.4M 36.9M 95.9M 1.8G 24.56 18/05/16-09:28 0.00 0.02 0.00 0.00 0.02 0.04 1.2G 457.5M 36.9M 95.9M 1.8G 24.57 18/05/16-09:29 0.00 0.02 0.00 0.00 0.02 0.03 1.2G 457.5M 37.0M 95.9M 1.8G 24.57 18/05/16-09:30 0.00 0.03 0.00 0.00 0.02 0.05 1.2G 458.4M 37.0M 95.8M 1.8G 24.62 18/05/16-09:31 0.00 0.02 0.01 0.00 0.02 0.05 1.2G 457.5M 37.0M 95.9M 1.8G 24.57 18/05/16-09:32 0.00 0.02 0.00 0.00 0.02 0.04 1.2G 457.5M 37.0M 95.9M 1.8G 24.57
显示一天内cpu的历史信息,以1分钟为间隔
1
2
3
4
5
6
7
8
9
10
11
12
13
14
15
16
17
18
19
20
21
22
$ tsar --cpu -i 1 Time -----------------------cpu---------------------- -----------------------mem---------------------- Time user sys wait hirq sirq util free used buff cach total util 18/05/16-09:14 0.00 0.02 0.00 0.00 0.01 0.04 1.2G 456.9M 35.9M 95.8M 1.8G 24.54 18/05/16-09:15 0.01 0.02 0.00 0.00 0.02 0.05 1.2G 456.9M 35.9M 95.8M 1.8G 24.53 18/05/16-09:16 0.00 0.02 0.00 0.00 0.01 0.04 1.2G 456.8M 36.0M 95.8M 1.8G 24.53 18/05/16-09:17 0.01 0.03 0.00 0.00 0.02 0.06 1.2G 456.6M 36.0M 95.8M 1.8G 24.52 18/05/16-09:18 0.19 0.46 0.08 0.00 0.02 0.67 1.2G 458.8M 36.7M 95.8M 1.8G 24.64 18/05/16-09:19 0.00 0.03 0.00 0.00 0.02 0.05 1.2G 457.9M 36.8M 95.8M 1.8G 24.59 18/05/16-09:20 0.00 0.02 0.00 0.00 0.02 0.05 1.2G 458.3M 36.8M 95.8M 1.8G 24.61 18/05/16-09:21 0.00 0.02 0.00 0.00 0.01 0.04 1.2G 457.8M 36.8M 95.8M 1.8G 24.58 18/05/16-09:22 0.01 0.02 0.00 0.00 0.02 0.05 1.2G 457.5M 36.8M 95.8M 1.8G 24.57 18/05/16-09:23 0.00 0.03 0.00 0.00 0.02 0.05 1.2G 457.6M 36.9M 95.8M 1.8G 24.57 18/05/16-09:24 0.00 0.02 0.00 0.00 0.02 0.05 1.2G 457.7M 36.9M 95.8M 1.8G 24.58 18/05/16-09:25 0.00 0.02 0.00 0.00 0.01 0.04 1.2G 457.7M 36.9M 95.8M 1.8G 24.58 18/05/16-09:26 0.00 0.02 0.00 0.00 0.02 0.05 1.2G 457.7M 36.9M 95.9M 1.8G 24.58 18/05/16-09:27 0.01 0.03 0.00 0.00 0.02 0.06 1.2G 457.4M 36.9M 95.9M 1.8G 24.56 18/05/16-09:28 0.00 0.02 0.00 0.00 0.02 0.04 1.2G 457.5M 36.9M 95.9M 1.8G 24.57 18/05/16-09:29 0.00 0.02 0.00 0.00 0.02 0.03 1.2G 457.5M 37.0M 95.9M 1.8G 24.57 18/05/16-09:30 0.00 0.03 0.00 0.00 0.02 0.05 1.2G 458.4M 37.0M 95.8M 1.8G 24.62 18/05/16-09:31 0.00 0.02 0.01 0.00 0.02 0.05 1.2G 457.5M 37.0M 95.9M 1.8G 24.57 18/05/16-09:32 0.00 0.02 0.00 0.00 0.02 0.04 1.2G 457.5M 37.0M 95.9M 1.8G 24.57
tsar监控虚拟内存和load情况
1
2
3
4
5
6
7
8
9
10
11
12
13
14
15
16
17
18
19
20
21
22
$ tsar --swap --load Time ---------------swap------------- -------------------load----------------- Time swpin swpout total util load1 load5 load15 runq plit 18/05/16-09:20 0.00 0.00 1.9G 0.00 0.00 0.00 0.00 0.00 147.00 18/05/16-09:25 0.00 0.00 1.9G 0.00 0.00 0.00 0.00 0.00 147.00 18/05/16-09:30 0.00 0.00 1.9G 0.00 0.00 0.00 0.00 0.00 149.00 18/05/16-09:35 0.00 0.00 1.9G 0.00 0.35 0.11 0.04 0.00 147.00 18/05/16-09:40 0.00 0.00 1.9G 0.00 0.00 0.03 0.01 0.00 147.00 18/05/16-09:45 0.00 0.00 1.9G 0.00 0.00 0.00 0.00 0.00 147.00 18/05/16-09:50 0.00 0.00 1.9G 0.00 0.00 0.00 0.00 0.00 147.00 18/05/16-09:55 0.00 0.00 1.9G 0.00 0.00 0.00 0.00 0.00 146.00 18/05/16-10:00 0.00 0.00 1.9G 0.00 0.00 0.00 0.00 0.00 146.00 18/05/16-10:05 0.00 0.00 1.9G 0.00 0.00 0.00 0.00 0.00 146.00 18/05/16-10:10 0.00 0.00 1.9G 0.00 0.00 0.00 0.00 0.00 147.00 18/05/16-10:15 0.00 0.00 1.9G 0.00 0.00 0.00 0.00 0.00 146.00 18/05/16-10:20 0.00 0.00 1.9G 0.00 0.00 0.00 0.00 1.00 148.00 18/05/16-10:25 0.00 0.00 1.9G 0.00 0.01 0.01 0.00 0.00 146.00 18/05/16-10:30 0.00 0.00 1.9G 0.00 0.00 0.00 0.00 0.00 146.00 18/05/16-10:35 0.00 0.00 1.9G 0.00 0.00 0.00 0.00 0.00 146.00 18/05/16-10:40 0.00 0.00 1.9G 0.00 0.00 0.00 0.00 0.00 146.00 18/05/16-10:45 0.00 0.00 1.9G 0.00 0.00 0.00 0.00 0.00 146.00 18/05/16-10:50 0.00 0.00 1.9G 0.00 0.00 0.00 0.00 0.00 146.00
tsar监控内存使用情况
1
2
3
4
5
6
7
8
9
$ tsar --mem Time -----------------------mem---------------------- Time free used buff cach total util 23/08/15-21:25 2.1G 5.7G 0.00 164.0M 8.0G 71.44 23/08/15-21:30 2.1G 5.7G 0.00 181.4M 8.0G 71.43 23/08/15-21:35 2.1G 5.7G 0.00 213.9M 8.0G 71.42 23/08/15-21:40 2.1G 5.7G 0.00 233.8M 8.0G 71.43 23/08/15-21:45 1.4G 5.7G 0.00 924.6M 8.0G 71.43 23/08/15-21:50 1.4G 5.7G 0.00 889.4M 8.0G 71.42
以2秒钟为间隔,实时打印mem的数据
1
2
3
4
5
6
7
8
9
$ tsar --live --mem -i 2 Time -----------------------mem---------------------- Time free used buff cach total util 18/05/16-11:30:59 905.8M 617.2M 219.4M 119.8M 1.8G 33.14 18/05/16-11:31:01 904.9M 618.1M 219.4M 119.8M 1.8G 33.19 18/05/16-11:31:03 904.9M 618.1M 219.4M 119.8M 1.8G 33.19 18/05/16-11:31:05 904.9M 618.0M 219.4M 119.8M 1.8G 33.19 18/05/16-11:31:07 904.9M 618.0M 219.4M 119.8M 1.8G 33.19 18/05/16-11:31:09 905.0M 618.0M 219.4M 119.8M 1.8G 33.19
tsar监控io使用情况
1
2
3
4
5
6
7
8
$ tsar --io Time ------------------------------------------sda------------------------------------------- Time rrqms wrqms rs ws rsecs wsecs rqsize qusize await svctm util 18/08/16-21:25 0.28 3.4K 184.40 389.25 4.9K 15.0K 35.47 3.00 6.35 0.29 16.44 18/08/16-21:30 0.00 3.2K 109.71 382.74 2.5K 14.5K 35.27 3.00 7.33 0.30 14.68 18/08/16-21:35 0.15 3.1K 156.91 342.16 3.8K 13.8K 36.15 3.00 6.60 0.29 14.37 18/08/16-21:40 0.86 3.3K 234.00 371.43 6.9K 14.6K 36.43 3.00 5.93 0.28 16.83 18/08/16-21:45 0.72 3.4K 376.80 357.13 11.7K 14.8K 37.03 3.00 4.84 0.25 18.50
tsar监控网络监控统计
1
2
3
4
5
6
7
8
9
10
11
12
13
14
15
16
17
18
19
20
21
22
23
24
25
26
27
28
29
30
31
32
33
34
35
36
$ tsar --traffic Time ---------------------traffic-------------------- Time bytin bytout pktin pktout pkterr pktdrp 18/05/16-09:20 42.00 33.00 0.00 0.00 0.00 0.00 18/05/16-09:25 12.00 2.00 0.00 0.00 0.00 0.00 18/05/16-09:30 6.00 3.00 0.00 0.00 0.00 0.00 18/05/16-09:35 3.00 2.00 0.00 0.00 0.00 0.00 18/05/16-09:40 8.00 2.00 0.00 0.00 0.00 0.00 18/05/16-09:45 16.00 2.00 0.00 0.00 0.00 0.00 18/05/16-09:50 11.00 3.00 0.00 0.00 0.00 0.00 18/05/16-09:55 8.00 2.00 0.00 0.00 0.00 0.00 18/05/16-10:00 9.00 2.00 0.00 0.00 0.00 0.00 18/05/16-10:05 77.00 167.00 1.00 0.00 0.00 0.00 18/05/16-10:10 146.00 377.00 2.00 1.00 0.00 0.00 18/05/16-10:15 31.00 60.00 0.00 0.00 0.00 0.00 18/05/16-10:20 51.00 120.00 0.00 0.00 0.00 0.00 18/05/16-10:25 27.00 26.00 0.00 0.00 0.00 0.00 18/05/16-10:30 2.00 3.00 0.00 0.00 0.00 0.00 18/05/16-10:35 10.00 2.00 0.00 0.00 0.00 0.00 18/05/16-10:40 22.00 2.00 0.00 0.00 0.00 0.00 18/05/16-10:45 10.00 3.00 0.00 0.00 0.00 0.00 18/05/16-10:50 16.00 3.00 0.00 0.00 0.00 0.00 Time ---------------------traffic-------------------- Time bytin bytout pktin pktout pkterr pktdrp 18/05/16-10:55 45.00 63.00 0.00 0.00 0.00 0.00 18/05/16-11:00 21.00 30.00 0.00 0.00 0.00 0.00 18/05/16-11:05 32.00 23.00 0.00 0.00 0.00 0.00 18/05/16-11:10 14.00 3.00 0.00 0.00 0.00 0.00 18/05/16-11:15 12.00 2.00 0.00 0.00 0.00 0.00 18/05/16-11:20 10.00 2.00 0.00 0.00 0.00 0.00 18/05/16-11:25 7.00 2.00 0.00 0.00 0.00 0.00 18/05/16-11:30 97.00 241.00 1.00 1.00 0.00 0.00 MAX 146.00 377.00 2.00 1.00 0.00 0.00 MEAN 27.04 44.12 0.15 0.08 0.00 0.00 MIN 2.00 2.00 0.00 0.00 0.00 0.00
1
2
3
4
5
6
7
8
$ tsar --tcp --udp -d 1 Time -------------------------------tcp------------------------------ ---------------udp-------------- Time active pasive iseg outseg EstRes AtmpFa CurrEs retran idgm odgm noport idmerr 18/05/16-00:05 0.79 1.52 1.6K 2.1K 0.00 0.03 3.4K 0.02 0.00 2.00 0.00 0.00 18/05/16-00:10 0.73 1.40 884.25 921.56 0.00 0.03 3.4K 0.01 0.00 3.00 0.00 0.00 18/05/16-00:15 0.77 1.46 959.62 1.0K 0.00 0.03 3.4K 0.01 0.00 3.00 0.00 0.00 18/05/16-00:20 0.69 1.43 1.0K 1.0K 0.00 0.03 3.4K 0.01 0.00 3.00 0.00 0.00 18/05/16-00:25 0.72 1.42 1.2K 1.1K 0.00 0.03 3.4K 0.00 0.00 3.00 0.00 0.00
tsar监控查看系统tcp连接情况,5秒刷新一次
1
2
3
4
5
6
7
8
$ tsar --tcp -l 5 Time -------------------------------tcp------------------------------ Time active pasive iseg outseg EstRes AtmpFa CurrEs retran 18/05/16-11:34:01 0.00 0.00 0.20 0.20 0.00 0.00 1.00 0.00 18/05/16-11:34:06 0.00 0.20 6.20 4.60 0.00 0.00 2.00 0.00 18/05/16-11:34:11 0.00 0.00 4.60 2.80 0.00 0.00 2.00 0.00 18/05/16-11:34:16 0.20 0.00 1.20 1.20 0.00 0.00 2.00 0.00 18/05/16-11:34:21 0.40 0.00 1.40 1.80 0.00 0.00 4.00 0.00
tsar检查告警信息
查看最后一次tsar的提醒信息,这里包括了系统的cpu,io的告警情况。
1
2
$ tsar --check --cpu --io localhost.localdomain tsar cpu:user=25.0 cpu:sys=2.1 cpu:wait=0.1 cpu:hirq=0.0 cpu:sirq=0.2 cpu:util=27.4 io:sda:rrqms=0.0 io:sda:wrqms=4172.4 io:sda:rs=80.3 io:sda:ws=493.0 io:sda:rsecs=1664.0 io:sda:wsecs=18661.7 io:sda:rqsize=35.5 io:sda:qusize=4.0 io:sda:await=7.7 io:sda:svctm=0.3 io:sda:util=18.5
tsar历史数据回溯
通过参数-d 2可以查出两天前到现在的数据,-i 1表示以每次1分钟作为采集显示。
1
2
3
4
5
6
7
8
9
10
11
$ tsar -d 2 -i 1 Time ---cpu-- ---mem-- ---tcp-- -----traffic---- --sda--- ---load- Time util util retran bytin bytout util load1 15/05/16-00:02 ------ 71.40 0.03 754.2K 421.4K 14.38 1.59 15/05/16-00:03 34.55 71.41 0.01 773.7K 400.9K 13.39 1.42 15/05/16-00:04 31.80 71.41 0.03 708.6K 391.9K 12.88 1.54 15/05/16-00:05 28.70 71.40 0.00 544.5K 305.9K 11.32 1.68 15/05/16-00:06 25.83 71.41 0.02 521.1K 280.4K 13.32 1.48 15/05/16-00:07 25.68 71.42 0.00 495.0K 265.2K 12.08 1.21 15/05/16-00:08 30.89 71.41 0.01 811.0K 280.1K 14.92 0.92 15/05/16-00:09 23.83 71.41 0.03 636.7K 349.4K 11.81 1.47
tsar查看指定日期的数据
1
2
3
4
5
6
7
8
9
10
11
12
13
14
15
16
17
18
19
20
21
22
$ tsar --load -d 20160518 #指定日期,格式YYYYMMDD Time -------------------load----------------- Time load1 load5 load15 runq plit 18/05/16-09:20 0.00 0.00 0.00 0.00 147.00 18/05/16-09:25 0.00 0.00 0.00 0.00 147.00 18/05/16-09:30 0.00 0.00 0.00 0.00 149.00 18/05/16-09:35 0.35 0.11 0.04 0.00 147.00 18/05/16-09:40 0.00 0.03 0.01 0.00 147.00 18/05/16-09:45 0.00 0.00 0.00 0.00 147.00 18/05/16-09:50 0.00 0.00 0.00 0.00 147.00 18/05/16-09:55 0.00 0.00 0.00 0.00 146.00 18/05/16-10:00 0.00 0.00 0.00 0.00 146.00 18/05/16-10:05 0.00 0.00 0.00 0.00 146.00 18/05/16-10:10 0.00 0.00 0.00 0.00 147.00 18/05/16-10:15 0.00 0.00 0.00 0.00 146.00 18/05/16-10:20 0.00 0.00 0.00 1.00 148.00 18/05/16-10:25 0.01 0.01 0.00 0.00 146.00 18/05/16-10:30 0.00 0.00 0.00 0.00 146.00 18/05/16-10:35 0.00 0.00 0.00 0.00 146.00 18/05/16-10:40 0.00 0.00 0.00 0.00 146.00 18/05/16-10:45 0.00 0.00 0.00 0.00 146.00 18/05/16-10:50 0.00 0.00 0.00 0.00 146.00
tsar查看所有字段
1
2
3
4
5
6
7
8
9
10
$ tsar --mem -D Time -----------------------mem---------------------- Time free used buff cach total util 18/05/16-09:20 1333063680.00 480555008.00 38567936.00 100483072.00 1952669696.00 24.61 18/05/16-09:25 1333542912.00 479940608.00 38682624.00 100503552.00 1952669696.00 24.58 18/05/16-09:30 1332707328.00 480657408.00 38801408.00 100503552.00 1952669696.00 24.62 18/05/16-09:35 961646592.00 644251648.00 227205120.00 119566336.00 1952669696.00 32.99 18/05/16-09:40 961708032.00 644059136.00 227336192.00 119566336.00 1952669696.00 32.98 18/05/16-09:45 961646592.00 643997696.00 227434496.00 119590912.00 1952669696.00 32.98 18/05/16-09:50 960610304.00 644898816.00 227569664.00 119590912.00 1952669696.00 33.03
查看fstab指定挂在的系统目录的使用情况 ,-I指定查看某个目录
1
2
3
4
5
6
7
8
9
10
11
12
13
14
15
16
17
18
19
20
21
22
23
24
25
26
27
28
29
30
31
32
33
34
35
36
37
$ tsar --partition -I / Time ---------------------------/---------------------------- Time bfree bused btotl util ifree itotl iutil 18/05/16-09:20 27.5G 19.1G 49.1G 42.00 2.7M 3.1M 14.71 18/05/16-09:25 27.5G 19.1G 49.1G 42.00 2.7M 3.1M 14.71 18/05/16-09:30 27.5G 19.1G 49.1G 42.00 2.7M 3.1M 14.71 18/05/16-09:35 27.5G 19.1G 49.1G 42.00 2.7M 3.1M 14.71 18/05/16-09:40 27.5G 19.1G 49.1G 42.00 2.7M 3.1M 14.71 18/05/16-09:45 27.5G 19.1G 49.1G 42.00 2.7M 3.1M 14.71 18/05/16-09:50 27.5G 19.1G 49.1G 42.00 2.7M 3.1M 14.71 18/05/16-09:55 27.5G 19.1G 49.1G 42.00 2.7M 3.1M 14.71 18/05/16-10:00 27.5G 19.1G 49.1G 42.00 2.7M 3.1M 14.71 18/05/16-10:05 27.5G 19.1G 49.1G 42.00 2.7M 3.1M 14.71 18/05/16-10:10 27.5G 19.1G 49.1G 42.00 2.7M 3.1M 14.71 18/05/16-10:15 27.5G 19.1G 49.1G 42.00 2.7M 3.1M 14.71 18/05/16-10:20 27.5G 19.1G 49.1G 42.00 2.7M 3.1M 14.71 18/05/16-10:25 27.5G 19.1G 49.1G 42.00 2.7M 3.1M 14.71 18/05/16-10:30 27.5G 19.1G 49.1G 42.00 2.7M 3.1M 14.71 18/05/16-10:35 27.5G 19.1G 49.1G 42.00 2.7M 3.1M 14.71 18/05/16-10:40 27.5G 19.1G 49.1G 42.00 2.7M 3.1M 14.71 18/05/16-10:45 27.5G 19.1G 49.1G 42.00 2.7M 3.1M 14.71 18/05/16-10:50 27.5G 19.1G 49.1G 42.00 2.7M 3.1M 14.71 Time ---------------------------/---------------------------- Time bfree bused btotl util ifree itotl iutil 18/05/16-10:55 27.5G 19.1G 49.1G 42.00 2.7M 3.1M 14.71 18/05/16-11:00 27.5G 19.1G 49.1G 42.00 2.7M 3.1M 14.71 18/05/16-11:05 27.5G 19.1G 49.1G 42.00 2.7M 3.1M 14.71 18/05/16-11:10 27.5G 19.1G 49.1G 42.00 2.7M 3.1M 14.71 18/05/16-11:15 27.5G 19.1G 49.1G 42.00 2.7M 3.1M 14.71 18/05/16-11:20 27.5G 19.1G 49.1G 42.00 2.7M 3.1M 14.71 18/05/16-11:25 27.5G 19.1G 49.1G 42.00 2.7M 3.1M 14.71 18/05/16-11:30 27.5G 19.1G 49.1G 42.00 2.7M 3.1M 14.71 18/05/16-11:35 27.5G 19.1G 49.1G 42.00 2.7M 3.1M 14.71 MAX 27.5G 19.1G 49.1G 42.00 2.7M 3.1M 14.71 MEAN 27.5G 19.1G 49.1G 42.00 2.7M 3.1M 14.71 MIN 27.5G 19.1G 49.1G 42.00 2.7M 3.1M 14.71
Tsar监控应用 Tsar默认支持的模块,如下
1
2
3
$ ls /usr/local/tsar/modules mod_apache.so mod_haproxy.so mod_load.so mod_mem.so mod_nginx.so mod_pcsw.so mod_pernic.so mod_squid.so mod_tcp.so mod_traffic.so mod_cpu.so mod_io.so mod_lvs.so mod_ncpu.so mod_partition.so mod_percpu.so mod_proc.so mod_swap.so mod_tcpx.so mod_udp.so
默认安装完后,只启用了系统相关的模块。如要监控应用就需手动启用相应模块,以Nginx为例
1
2
$ vim /etc/tsar/tsar.conf mod_nginx on
验证Nginx模块是否启用
1
2
$ tsar -L|grep nginx nginx
配置Nginx
该配置主要是为nginx开启status统计页面,给tsar提供http数据。Tsar统计的原理是通过获取status页面的输出结果,并对输出内容进行统计和计算得出的结果。而且其获取状态页的url默认是http://127.0.0.1/nginx_status ,所以在nginx上你必须有如下的配置
1
2
3
4
5
6
location /nginx_status { stub_status on; access_log off; allow 127.0.0.1; deny all; }
注:以上的url并非不能更改,可以修改环境变量实现。其自带的几个环境变量如下。
1
2
3
4
export NGX_TSAR_HOST=192.168.0.1 export NGX_TSAR_PORT=8080 export NGX_TSAR_SERVER_NAME=status.taobao.com export NGX_TSAR_URI=/nginx_status
监控Nginx状态
1
2
3
4
5
6
7
8
9
10
11
12
$ tsar --nginx -l -i 2 Time ----------------------------------------------nginx--------------------------------------------- Time accept handle reqs active read write wait qps rt sslqps spdyps sslhst 18/05/16-13:11:30 1.00 1.00 1.00 1.00 0.00 1.00 0.00 0.20 0.00 0.00 0.00 0.00 18/05/16-13:11:35 1.00 1.00 1.00 1.00 0.00 1.00 0.00 0.20 0.00 0.00 0.00 0.00 18/05/16-13:11:40 1.00 1.00 1.00 1.00 0.00 1.00 0.00 0.20 0.00 0.00 0.00 0.00 18/05/16-13:11:45 1.4K 1.4K 1.4K 1.00 0.00 1.00 0.00 280.40 0.00 0.00 0.00 0.00 18/05/16-13:11:50 1.00 1.00 1.00 1.00 0.00 1.00 0.00 0.20 0.00 0.00 0.00 0.00 18/05/16-13:11:55 1.00 1.00 1.00 1.00 0.00 1.00 0.00 0.20 0.00 0.00 0.00 0.00 18/05/16-13:12:00 10.1K 10.1K 10.1K 1.00 0.00 1.00 0.00 2.0K 0.00 0.00 0.00 0.00 18/05/16-13:12:05 2.00 2.00 2.00 1.00 0.00 1.00 0.00 0.40 0.00 0.00 0.00 0.00 18/05/16-13:12:10 1.00 1.00 1.00 1.00 0.00 1.00 0.00 0.20 0.00 0.00 0.00 0.00
参考文档 http://www.google.com http://code.taobao.org/p/tsar/wiki/index/ http://blog.csdn.net/Road_long/article/details/47959221 http://blog.itpub.net/22664653/viewspace-1273519/ http://www.361way.com/tsar-nginx/2308.html